Recent developments in New Jersey’s housing market
Since the Great Recession, and the collapse of the housing market that came with it, several trends have emerged in the following decade of recovery. Housing prices have recovered from the bottom the market hit in 2007/2008 and even begun surging to new highs. This trend has been clear and predictable. Surprisingly, however, homeownership by individuals has remained lower than pre- recession levels. In fact, the national homeownership rate has continually been dropping since the recession and is now hovering at decade lows.
New Jersey has been no exception to these trends. Using data on real estate deeds obtained from CoreLogic Solutions, as well as public information from the U.S. Census Bureau and Zillow Research (for Home Price Index [HPI] numbers), we examine the trends in residential properties by aggregating transactions. We focus on the period from 2004 to 2015, where we have the most data and can view the trends before, during, and after the recession.
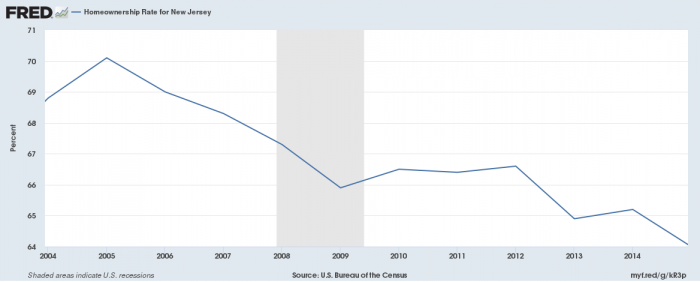
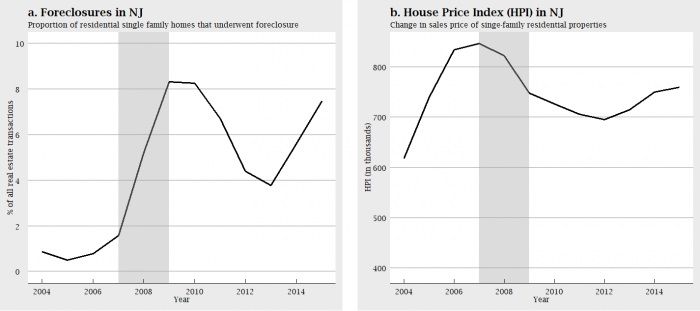
Immediately, the decline in homeownership rate in New Jersey is evident and significant. In this time period we see homeownership peak at 70.1% in 2005 and then consistently fall to the 2015 rate of 64.0%. This 6.1% decrease represents an estimated decrease of 195,000 fewer households owning homes in NJ2. In this same time period, we see the foreclosure rate shoot up. Foreclosures peak at just above 8% in 2009 and 2010, and while it does begin to recover, the level is elevated far above pre- recession levels that hovered around 1%3. In recent years the foreclosure rate in New Jersey has again begun to increase, and by 2015 has nearly reached peak recession levels. Meanwhile, we observe that real estate prices4 in New Jersey have also started to recover since the housing bust, albeit the average single-family house price has not yet reached the highest pre-crisis levels. However, residential sales prices are already back in the 2006 range and rising. House prices have experienced moderate recovery without any pick-up in the homeownership rate whatsoever. Together, these trends tell us that while the prices of single-family residences have recovered from the mortgage crisis, individuals have not enjoyed much of this recovery as foreclosures remain high and homeownership persists ever lower.
So what is driving these developments and shaping the behavior of the housing market in the past decade? One possible answer is institutional investors including limited liability companies, real estate investment trusts, and other financial entities. Taking advantage of deflated prices and plentiful foreclosures – especially in certain regions of New Jersey – institutions have been purchasing real estate in previously unseen numbers. Rather than reselling these properties for capital gains, many have rather chosen to convert homes into rental properties and thus create a steady stream of rental income. The result is a significant upswing in housing prices, with much of the resulting profits going to institutions instead of individuals who find themselves unable to afford purchasing their own homes.
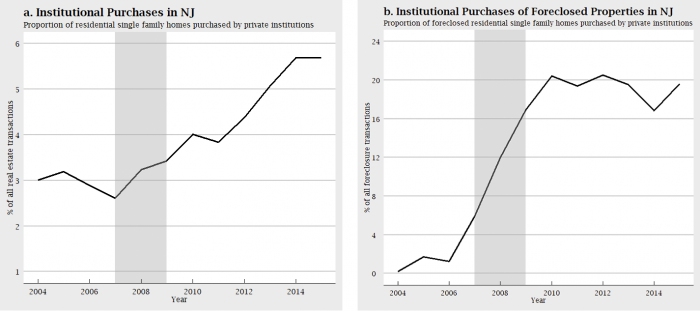
Now we examine trends related to institutional involvement in New Jersey’s real estate market. Again, we will focus on single-family housing transactions from 2004 to 2015. While institutions’ share of the market by proportion of purchases is flat before the recession, we see consistent increases in institutional purchases thereafter, nearly doubling from 3% to just under 6%. While the recession had a major impact on lowering the price of homes, the institutional purchasing rate only increases during this period. As prices recover, institutions continue to buy up properties. In fact, a high foreclosure rate and decreased housing prices allowed institutions to purchase properties at a steep discount. It is not surprising then that the share of transactions involving institutions is even greater for foreclosed properties. While this proportion was very small in the early 2000s, it skyrocketed during the housing bust and has held at a level around 20% of all foreclosed property purchases. Although it is difficult to attribute the exact cause of the subsequent recovery in housing prices post-recession, there is strong evidence that, compared to historical recoveries, institutions have been playing a much larger role than individuals this time around.
If we break it down by counties in New Jersey, we can see that these trends are especially dramatic in certain regions of the state.
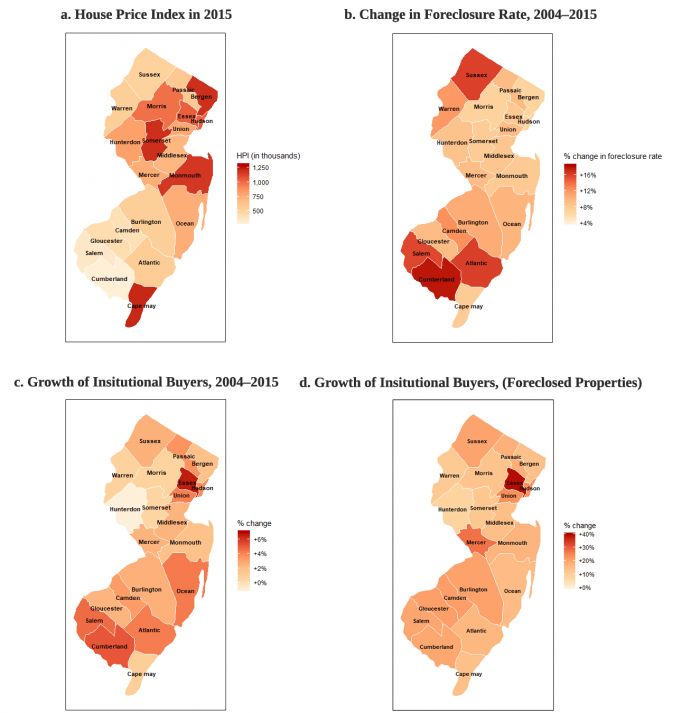
Here we see that in many of the counties where the foreclosure rate has increased the most, such as Salem and Cumberland in south NJ, institutions have most grown their presence as buyers. These are also the counties where the HPI today is relatively lower, indicating cheaper homes.
Institutions with large reserves and a much greater ability to spend than individuals (and individual investors) are able to take advantage of the downturn in prices caused by the housing crash and reap the rewards when prices inevitably climb back up. Interestingly, Essex County – a relatively affluent county in NJ – had the greatest increase in institutional buyers between 2004 and 2015.
One last distinction before and after the recession is what types of institutions are key players in the New Jersey housing market. In 2004, the institutions buying the most single-family homes were primarily relocation companies that provide relocation services. After the recession, however, we see a shift in the nature of the companies buying homes. In 2014, while relocation service firms remain in the mix, there is now a greater involvement from institutional investors such as real estate investment trusts and financial firms, especially in cheap foreclosed properties where the proportion of institutions as overall buyers is even higher. The dynamics of the real estate market has shifted as more and more banks and financial firms have jumped into the buy side. These institutions have different goals in their property ownership than the early 2000s relocation companies, influencing some of the changes we have seen occurring.
So why have institutions become more involved in real estate ownership? There are several plausible explanations. Interest rates have been kept persistently low in the decade following the recession as the Fed has encouraged spending to stimulate the economy. This has forced investors desiring higher returns to search for investments outside capital markets. Real estate investments are one such alternative. The regulations imposed on banks by the Dodd-Frank Act have also tightened the mortgage market, resulting in home purchasing becoming financially difficult for some individuals that would have previously relied on such bank loans. Thus a restricted mortgage supply for individuals has opened the door for institutions to grow their holdings as property owners. Combined with wage stagnation and high household-debt even during the growing economy of the past decade, individuals have had their ability to become homeowners restrained. This gap in buyers presents institutions with the opportunity to capitalize on potential profits in the single-family housing market.
The result of these trends has been a mixed bag for New Jersey residents. Low homeownership rates prevent households from accumulating wealth in traditional manners. Renting, rather than owning, a home results in individuals lacking home equity – historically a cornerstone of financial security for many Americans. While a variety of factors can be pointed to as the cause of depressed homeownership, institutional investors are clearly involved. When institutions choose to rent properties rather than resell, this has the two-pronged effect of increasing house prices and crowding out individuals. On the other hand, there is some evidence that institutions have been driving the growth of housing prices, a positive trend for current homeowners. For those already looking to rent, the growth of rental properties has increased the availability of options. Undoubtedly, it will be crucial to continue monitoring these trends in order to better understand the behavior of the housing market today and predict how changing economic conditions may affect it moving forward.
1 Wenli Li: Senior Economic Advisor and Economist Department of Research, Federal Reserve Bank of Philadelphia. Tal G. Roded: University of California, San Diego. The views expressed here do not represent those of the Federal Reserve Bank of Philadelphia or the Federal Reserve System.
2 Using the U.S. Census Bureau estimates of NJ households 2012-2016, which was about 3.2 million.
3 For our calculations, we delete nonarm’s length transactions with nominal transaction prices. This includes banks taking possession of foreclosed properties. Therefore, our foreclosure rate serves as a lower bound.
4 HPI data obtained from Zillow Research Data: “Single-Family Residences ($): Median estimated home value for all detached single-family homes within a given region.” HPI is in nominal terms.