
Photo credit: YUBO (gettyimages)
A steady economic performer confronts heavy weather.
The New York metropolitan area (NYMA) is in a relatively stable and solid state from a business cycle perspective with a tight labor market employed in a diverse array of service industries, rising wages and a low unemployment rate. However, the region faces a number of structural headwinds that weigh on its growth prospects. Net outmigration of residents has accelerated since 2016, possibly related in part to provisions in the Tax Cut and Jobs Act that raised effective tax burdens and adding to an established trend of population decline. Shrinking populations are a headwind to the real estate sector which has also seen overbuilding of high-end condos in recent years. In stark contrast to the national average, home valuations in the NYMA are still well below their prior cycle peak. A declining tax base exacerbates budget pressures faced by state and local governments in the region that are grappling with rising pension and health care obligations and infrastructure in need of investment. Companies are still choosing to locate in New York highlighting the strength of the workforce and thriving business conditions, but the region continues to underperform the growth enjoyed by other cities and regions.
New York Metropolitan Area: Slow Growing with an Increasingly Diverse but Shrinking Population
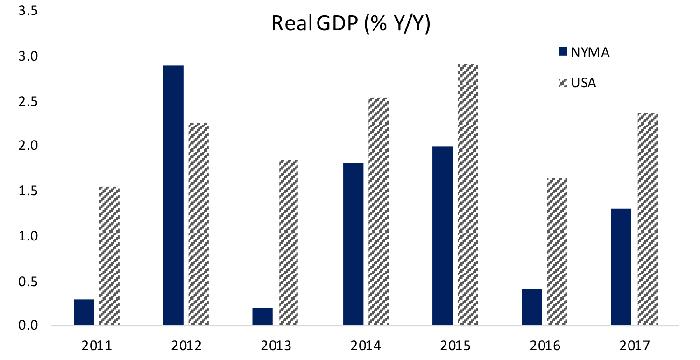
The New York metropolitan area (NYMA) includes New York City, Long Island, and the Mid and Lower Hudson Valley in the state of New York. In New Jersey the NYMA includes Newark, Jersey City, Paterson, Elizabeth, and Edison, and their vicinities. It also includes southern Connecticut and a snippet of eastern Pennsylvania. While economic growth has been increasingly concentrated in urban areas in the current recovery, the NYMA has underperformed. Data are only available as the metropolitan level through 2017, but Figure 1 highlights that the shortfall in annual GDP growth rates between 2011 and 2012 averaged 0.9%. The underperformance can’t be explained by adjusting for differentials in population and looking at growth in per capita terms.
Figure 1: The New York Metropolitan Area has Underperformed Throughout the Recovery
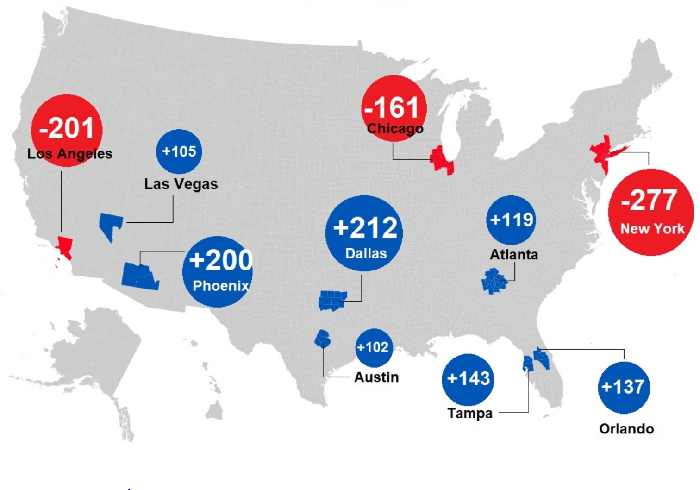
The New York metropolitan area’s (NYMA) population has been shrinking for the past three years. The Census estimates that the NYMA population peaked at 8,476 thousand people in 2016 and has shrunk about 0.5% per year since then. According to analysis by Bloomberg of detailed demographic surveys the region ranks relatively low among birth rates at 43rd among major metropolitan areas, but it has a relatively young population and ranks 58th in death rates leaving organic population growth of 0.4% in 2018. However, the metro area lost about 200,000 residents that same year, which was partially offset by nearly 100,000 immigrants as New York and New Jersey remain top destinations for international arrivals. Figure 2 illustrates that the metro area is shrinking faster than any other city, part of an overall pattern of people moving away from high cost coastal cities to lower cost southern ones. Net migration has been negative for the NYMA since 2011, but the pace nearly doubled after 2016. New York has by far the highest foreign-born population in the country at 29%, more than twice the national average and rising given immigration accounts for all population growth.
Figure 2: Daily New Departures and Arrivals to Metropolitan Areas in Excess of 100 in 2018
The NYMA Labor Market: A Stable Service Sector Economy
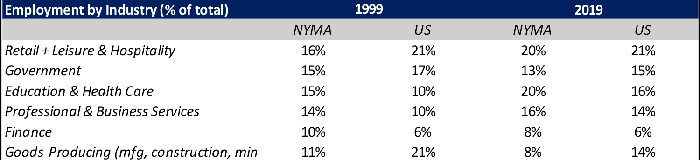
Employment in the NYMA is concentrated in a handful of service sector industries. Figure 3 illustrates that twenty years ago five service industries accounted for 70% of employment in the NYMA as compared to 64% for the national economy, while a much smaller share of the NYMA job market is devoted to goods producing sectors including manufacturing, construction and mining. Over the past twenty years that share has grown to 77% for the NYMA and 72% for the national labor market. For the NYMA the rising share of service employment was driven by gains in retail and leisure and hospitality as the tourism industry has grown, and health care and private education tied to an aging population. Professional and business services have also increased in importance at the local and national level even as government employment and finance account for a somewhat smaller share of total employment.
Figure 3: The NYMA Labor Market Dominated by Service Sector Industries
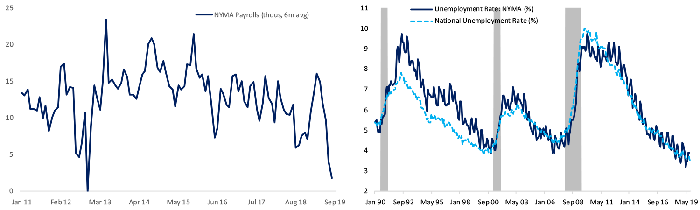
In recent months slowing GDP growth and hiring and an inversion of the yield curve have led to rising speculation the US economy is headed for recession. Job growth in the NYMA has slowed even more than the national average, from about 15k per month in recent years to just 2k over the past six months with three months of job losses over the past four months (Figure 3, left side). In contrast the national pace of hiring has slowed moderately to around 150k from a pace above 200k in recent years. Slowing in the New York metropolitan area has been seen in professional and business services and finance even as the retail and leisure and hospitality sectors have bucked the national slowing trend with steady modest gains. Despite the slowing in hiring the NYMA unemployment rate stood at 3.9% in August, up from the cycle low but close to the national average and historical lows (Figure 3, right side). The combination of a modestly shrinking population and a cyclical recovery in labor force participation means growth in the NYMA labor force in recent years has been roughly flat. Slowing in job creation isn’t a sign of cyclical weakness, but a reflection that the region is shrinking for structural reasons. Confirming that assessment, average hourly earnings in the NYMA remain nearly 20% higher than the national average and have been growing at an annual rate close to 4% over the past year, faster than the national pace below 3%.
Figure 4: Slower Hiring Matches a Shrinking Population, Unemployment Remains Low
A Real Estate Sector Struggling with Tax Changes, Overbuilding and Declining Demand
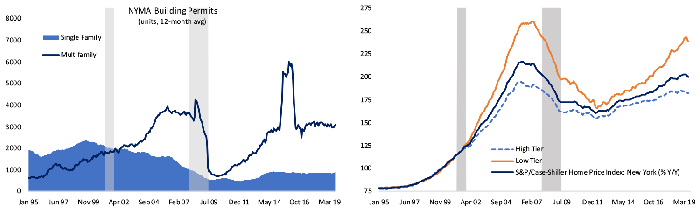
A shrinking population is not a tailwind for the housing and construction sectors. The left panel of Figure 5 illustrates that building permits issued for single family and multifamily construction have been flat in recent years at a lower pace of activity than in the prior cycle, except for a pop in multifamily permits spurred by a shift in building codes in 2015. Even before the housing crisis multifamily building began to outpace single family construction in the region reflecting a relatively low and falling homeownership rate (currently 50.5% as compared to 64.2% nationwide and 54.7% at the peak in 2005), as well as rising density and a greater share of condominiums. New multifamily construction currently outpaces single family by more than three to one.
The steady, subdued pace of multifamily construction has nonetheless produced a glut of supply. A recent analysis by Streeteasy found that more than 25% of new condos built in New York City since the start of 2013 remain unsold, and there is still a bulging pipeline of supply coming online. The overbuilding has been concentrated at the high end and has weighed on valuations. The right panel of Figure 5 illustrates the S&P/Case-Shiller home price index for the NYMA. In contrast to every national home price index, valuations in NYMA are still well below their prior peaks. Lower-priced homes saw the bigger boom and bust in the housing bubble and are now experiencing a more robust recovery. High-end homes are still more than 6% below their peak valuations and have seen prices decline 0.5% thus far in 2019.
Figure 5: Construction Activity has been Steady Through Much of the Recovery
The NYMA is in a relatively stable and solid state from a cyclical perspective but faces more structural headwinds that weigh on its growth prospects. The trend toward subdued population and economic growth was well established before the Tax Cut and Jobs Act of 2017, but limitations on mortgage interest and state and local tax deductions included in the legislation raised the effective tax burden for NYMA residents and may have contributed to the acceleration in net outmigration of residents since its passage, as well as reduced demand for higher-end housing. The 100bps decline in mortgage rates over the past year has boosted homes sales and construction at the national level but may have only served to prevent a decline in the NYMA. The shrinking population in the region exacerbates budget pressures state and local governments are facing due to shrinking tax bases and rising pension and health care obligations even as local infrastructure is suffering from lack of investment. The desire of Amazon to locate their HQ II in New York highlights the advantages of workforce talent and thriving business conditions in the NYMA but the controversy surrounding their decision highlights some of the structural headwinds.