A first look at housing “affordability” in New Jersey and the United States
Eight out of ten Americans flag “housing affordability” as a problem, with six of those ten labeling the problem “serious.” Google searches indicate that searches on “affordable housing” have been peaking recently at their highest level over the past 5 years. More to the point for many readers of Rutgers blog are recent controversies over affordable housing plans in New York, and a recent State Supreme Court decision in New Jersey that seems to resolve the long-running and contentious disputes following Mount Laurel in favor of requirements for towns to permit construction of “affordable housing,” whatever that might mean in practice.
It’s not surprising that housing looms large in our consciousness. If we measure “out of pocket” spending, shelter (housing and related utilities) is the largest category, followed by health care. There’s a large portfolio of evidence, some of which we’ll examine in future posts, that a healthy, affordable housing market is one of the underpinnings of a stronger and fairer economy, whether we’re talking about our country, the state, or the local level. Conversely, if the housing market is not performing, many economic and social problems can be tied to high housing costs, the root of “unaffordability.” These problems can include, for example, reduced consumption of other goods and services; large differences in the distribution of wealth; reduced homeownership; decreased labor mobility, lack of economic development, and increased portfolio risk and volatile financial markets. In Chapter 4 of his recent magisterial history of the American economy, Robert Gordon has documented in detail how many of the 20th century’s advances in living standards – electrification, ample clean piped in water, modern sanitation, heating and cooling, too many more to mention here – are bundled into improvements in housing size, quality and affordability. Today most of us take these remarkable social and environmental improvements for granted.
What is “Affordability?”
“Affordable housing” has many meanings, which gives rise to confusion, and leads me too often put the term in quotes. (Once we get through this section on definitions I’ll mostly drop the quotes on “affordable.”) In order to clarify some of those meanings, let’s recall two kinds of propositions. In logic, positive statements are about “what is;” positive statements are about facts. Positive statements are testable. We can find out whether they are true or false, at least in principle. Are houses of a given quality level more expensive in Trenton, or Newark? That’s a positive proposition. Normative statements, on the other hand, are about “what should be,” they are opinions. Normative statements imply a value judgment. Normative statements are not testable. Is Chatham a better place to live, or Summit? This is not so readily tested, and depends largely on one’s preferences. We can explore the question, but it’s hard to argue with tastes.
Normative ideas about affordability revolve around what somebody thinks it’s appropriate to pay, an opinion. Housing advocates tend to focus on normative ideas about affordability. Positive ideas about affordability revolve around what people do pay, a fact. Economists tend to focus on positive notions of “affordable.”
There’s more. Sometimes, the term is applied to the unit itself. For example, we might use “affordable” to denote housing units that rent or sell for moderate amounts. Then we’d need to pick a threshold, for example rents less than 30 percent of income, or houses selling for less than $100,000. Sometimes, the term “affordable” refers to housing units in particular housing programs (e.g. public housing, or Section 42 Low Income Housing Tax Credit units). Sometimes, we mean housing units utilized by particular kinds of households, in particular those with very low incomes.
The most common threshold value for housing affordability is 30 percent of income devoted to expenditure on rent and core utilities. Households spending more than 30 percent are said to be “cost burdened” by the US Department of Housing and Urban Development (HUD) and other government agencies. Sometimes the 30 percent threshold is referred to as “Moderate Cost Burdened,” is in contrast to “Severe Cost Burdened,” which indicates the household is spending more than half their income on housing.
Any threshold used to categorize people or households has an unavoidable arbitrariness. Using more than two categories (for example, “Severely Cost Burdened,” with rent-to-income greater than 50 percent, and “Moderate Cost Burdened,” with rent-to-income between 30 percent and 50 percent, and “Not Cost Burdened,” with rent-to-income less than 30 percent) mitigates but does not eliminate the problem. The problem is inherent in any such categorization e.g. classifying people as “poor” or “not poor.”
Economists point out some other issues with such a single fixed threshold. Consider Exhibit 1.
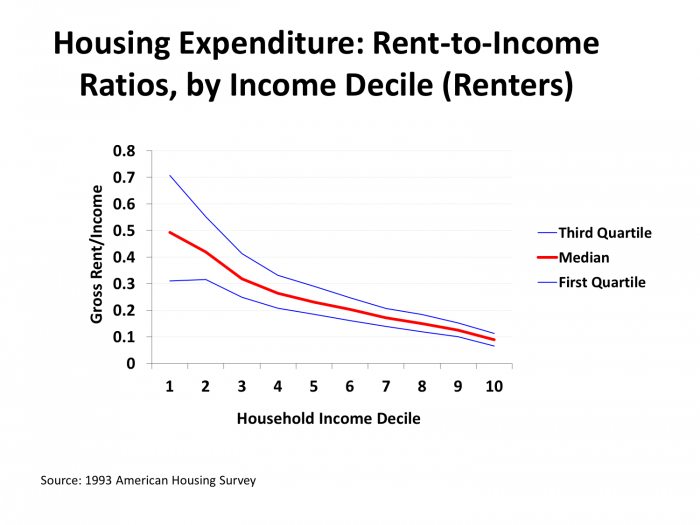
The Exhibit, taken from Green and Malpezzi (2003), uses American Housing Survey data to illustrate how housing’s budget share actually changes with income within the United States. To prepare Exhibit 1 Green and Malpezzi began with about 60,000 individual survey households, renters and owners. We sorted that data into 10 income deciles, where decile 1 is the lowest income group, and decile 10 is the highest. We then focused on renters, and calculated the rent-to-income ratio for about 20,000 individual survey households. Within each income decile, we then calculated the median of the individual rent-to-income ratios. The thick red line in the middle presents the median rent-to-income within each of the 10 deciles. The blue lines above and below the median line are similar calculation for the first and third quartiles of rent-to-income within each group.
The pattern is strong and obvious. Housing budget shares fall as incomes rise, consistent with what economists call inelastic demand; in plain English, housing, like food, is a necessity. Further, the variance within deciles falls dramatically as income rises. This general pattern holds up even if we control for other household characteristics. Homeowner demand, not shown, is similarly inelastic. Many other studies using data for earlier and later years, and from other survey sources, confirm the pattern.
The key result for our purposes is that the constant rent-to-income ratio threshold used in most affordability calculations runs counter to the empirical evidence of how households actually spend their money. If we adopt a willingness-to-pay or ability-to-pay perspective, we’d have this threshold rising as incomes fall. Making such a change is unrealistic, however, partly because it’s complicated, and partly because it would probably be politically untenable. We will later use the standard affordability thresholds, but aware that as long as we use such a simple approach, “unaffordability will always be with us.”
The single fixed affordability ratio is not just an analytical oversimplification; it’s baked into housing programs. The 1969 Brooke Amendment to the 1937 Housing Act mandated that if in a federal housing program, no family would be required to pay more than, first 25 percent, and after a 1981 amendment 30 percent, of their income on housing.
Housing Budgets: More Facts from State Comparisons
For the rest of this first blog post on affordability, we’ll look at some basic data, comparing the tri-state area – New Jersey, New York, and Connecticut – to the rest of the 50 states and the District of Columbia. With Exhibit 2 we’ll start with the most basic indicators of affordability, rents and housing values.
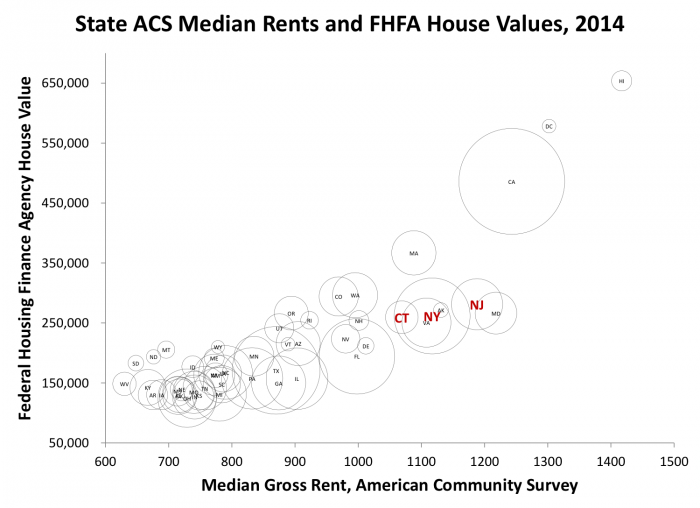
The vertical index presents an index of median house values in 2014, constructed by the Federal Housing Finance Agency; the horizontal axis presents 2014 median gross rents, from the American Community Survey. Each state’s data is represented by its postal abbreviation; the circles around the state abbreviations are proportional to the state’s population.
Gross rents vary substantially across states, by more than a factor of two: from $630 in West Virginia, the least expensive state; to the “top of the charts” Hawaii’s median rent of $1420. The national median rent, for comparison, is $920. At $1190 per month, New Jersey ranks number 5 in median gross rents. Examining our tri-state neighbors, New York at $1120 (ranked #7) and Connecticut at $1070 (ranked #10) are also more expensive than most states.
House values have even more variation than rents, as Exhibit 2 also shows. The difference between the highest states (Hawaii at $654,000, DC at $578,000) and the lowest states (Ohio at $125,000 and Indiana at $127,000) is a factor of five. The U.S. median value is $213,000. New Jersey is the 7th most expensive state by this measure, at $281,000. Our tri-state neighbors come in at New York’s $262,000 (ranked #11), and Connecticut’s $260,000 (ranked #12)
Much of this observed variation in rents and values may be explained by demand (i.e. by things like jobs and income and population growth) and by supply (i.e. things like physical geography, the age of the existing stock, and the regulatory environment for new development or management of the existing stock). Such locational pricing works at both the “large” level of states and cities, and at the “small” level of locations within cities. Neighborhoods with good schools, low crime rates and so on will be worth more than neighborhoods with opposite characteristics. Locations next to a noisy airport or a polluting factory will similarly be less expensive, while neighborhoods with good views or particularly nice environmental features will cost more. Access to transportation is another feature that drives rents and values. The point is that when we look at the usual measures of housing affordability, we are observing some combination of price and quantity. By quantity, we mean things like square footage, the quality of the unit, the characteristics of the neighborhood, the location of the unit relative to jobs and other necessary conveniences.
Thus, looking at rents and values — what we spend – is not the same as observing the price of a unit, since each unit delivers a nearly unique (sometimes quite unique) combination of size, quality and location. Thinking about expenditure as “affordability” can muddy the waters, if, for example, some households (even poor households) have high levels of demand for housing, all-in. In turn, apparent housing “affordable” housing may mask shortcomings, for example if markets somehow fail to deliver the right size and quality of housing in the right location.
So if by “affordable” we mean simply inexpensive or low cost, we all know there is lots of affordable housing somewhere within the U.S.; but it might have a high price once we account for the fact that the bundle of characteristics that unit delivers might not be desirable. Some neighborhoods in Newark have lots of inexpensive housing, if one looks merely at rents and not the services the unit delivers; the same is true for, say, rural Pennsylvania or Kentucky. Green and Malpezzi’s Primer on U.S. Housing Markets and Policy provides a more detailed discussion about how to adjust the data for these differences in quantity and quality and location.
To economists, high prices that reflect underlying benefits are important signals. For example, “build more housing over here, where there is a good return;” “not over there, where its value is below cost.” It is important to keep this more nuanced view of housing in mind when considering whether various government interventions, such as taxes, subsidies or regulations might artificially raise prices without producing the kind of housing characteristics people value. We will have a lot more to say about this in later posts, when we look at the links between affordability and different ways of taxing and subsidizing and regulating housing and urban development.
Bringing Income into the Mix
Another point that cannot be overemphasized is that often the real “affordability” problem is more about a difficult situation in which many residents have very low incomes. Improving their productivity and their incomes may well be the most important task in many situations. For now, we’ll defer full discussion of that complex subject, but in the next Exhibit we will examine rents and values in relation to incomes.
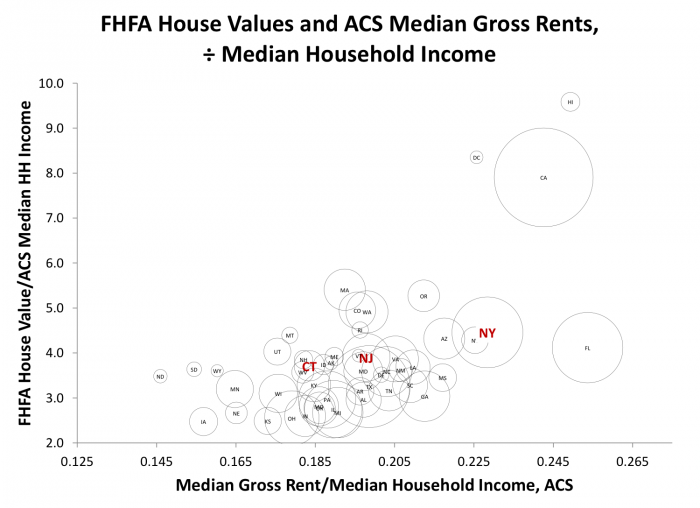
As we’ve already noted, many discussions of affordability focus on the relationships between rents/values, and incomes; also known as budget shares. Exhibit 3 presents these basic data. New Jersey’s median gross rent-to-income ratio, 20 percent, is just below the national ratio of 21 percent, ranking number 20 among the states. New York’s ratio is higher, coming in at 23 percent (ranking #4), while Connecticut’s is lower, at 18 percent (ranking # 37). The 3 least affordable states by this measure, with rent-to-income ratios ranging from 24-25%, are Florida, Hawaii, and California. The 3 most affordable, those with budget shares ranging from 15-16 percent, are North Dakota, South Dakota, and Iowa.
There’s even more variation in the home value-to-income ratio, the vertical axis in Exhibit 3. By this metric Hawaii is the least affordable, coming in at a median-value-to-median-household-income of just below 10; while the bottom states, Kansas and Iowa are at 2.5. The most and least affordable states by this metric differ by a factor of four. With a value-to-income ratio of 3.9, New Jersey ranks 17th among the 51 states and the District of Columbia, and is almost identical to a ratio of 4.0 for the nation as a whole. Our neighboring states come in at a ratio of 4.5 for New York (#9) and 3.7 for Connecticut (#22).
A First Look at the Bottom of the Market
The variation in housing budget shares documented in Exhibit 1 suggests that looking at median measures masks a lot of variation among households at different income levels. Most housing affordability programs and discussions are focused on lower income households who also are most likely to be severely cost burdened.
Exhibit 4 identifies the states with the most severe housing affordability issues by looking at both the degree of poverty and the burden of housing costs. The horizontal axis marks the Census Bureau’s “Supplemental Poverty Measure” (SPM), which is essentially the poverty threshold adjusted for cost of living in each state. New Jersey’s poverty rate using the SPM is 15.1 percent, which happens to be the same as the national average. New York’s poverty rate is higher, at 17.9 percent; Connecticut’s is lower, at 12.8 percent.
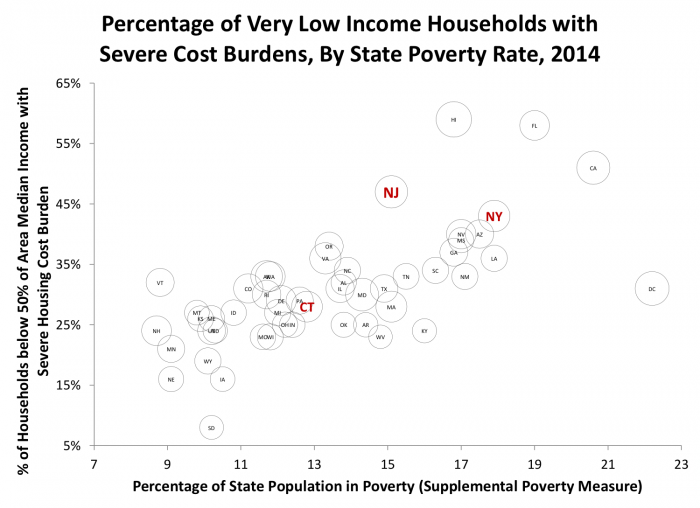
The vertical axis in Exhibit 4 is the fraction of Very Low Income (VLI) households experiencing a Severe Housing Cost Burden, i.e. with gross rents more than 50 percent of household income. Very Low Income households are those whose incomes fall below 50 percent of Area Median Incomes. The cost burden data on the vertical axis come from the American Community Survey, as compiled by the National Low Income Housing Coalition. The area of the circles surrounding the state abbreviations in Exhibit 4 are proportional to state median gross rents, also from the American Community Survey.
Several patterns are immediately apparent. Poorer states also have bigger fractions of their VLI population facing Severe Cost Burdens for housing, although there is substantial variation around this pattern. New Jersey is about at the national average SPM, but well above average in the fraction of poor households facing a Severe Cost Burden, while New York is above average in both measures and Connecticut is below average.
Nationwide, 36 percent of Very Low Income households report a Severe Cost Burden; that is, rent-to-income ratios greater than 50 percent. Locally, 47 percent of New Jersey’s Very Low income households report a Severe Cost Burden, making it one of the least affordable states. New York, with 43 percent of their VLI population facing a Severe Cost Burden, is right behind, ranked number 5. Connecticut does better, with 28 percent of VLI households facing SCBs (ranked 30th among states). Hawaii fares worst, with 59 percent of VLI spending more than 50 percent of their income on rent; South Dakota, with only 8 percent in this situation, does best.
A First Look at Property Taxes and House Values
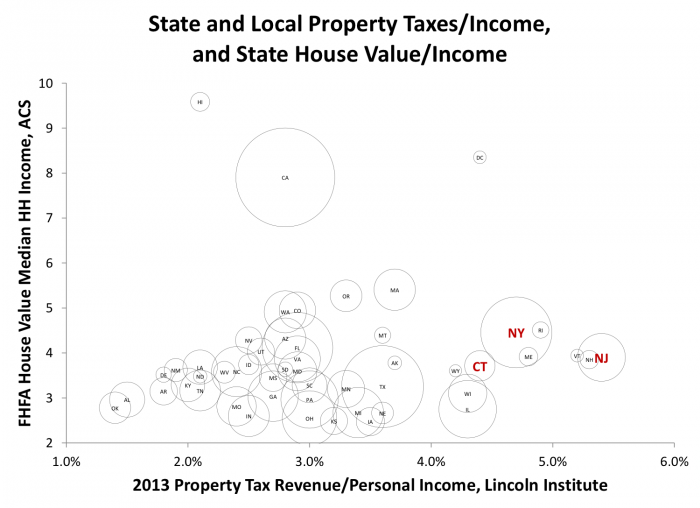
We will end our look at different aspects of housing costs by going back to state averages and taking a look at a particular New Jersey favorite, property taxes. On any slow news day it’s easy enough to write another article about New Jersey’s high property tax rate. Carefully collected data from the Lincoln Institute of Land Policy confirms what most readers already knew: New Jersey ranks number 1 in property taxes as a fraction of household income. In 2013, according to Lincoln, New Jerseyites paid an average of about $3000 in property taxes, or 5.4 percent of their income, compared to $1440, or 3.2 percent of income nationally. New York and Connecticut are also high property tax states; property taxes averaged $2500 and $2700 respectively, or 4.7 percent of incomes, respectively. Each of the tri-states was no lower than 7th in any ranking of property taxes, whether levels or percentage of income.
Do property taxes themselves drive housing prices, that is, are taxes “capitalized” into value? With the caveat that such a simple two-way plot is hardly the last word, we don’t see much of a pattern between house values and property tax rates in Exhibit 5. If capitalization is at work, perhaps tax capitalization and service benefit capitalization are roughly canceling each other out. That’s a conjecture at this moment, to be sure. At the least, we can’t see any simple correlation between property taxes and values, at the state level, in Exhibit 5.
Wrapping Up
Housing “affordability” is one of those complicated topics that are similar to macroeconomics or string theory: if you’re not a little confused, you’re probably not yet thinking clearly.
The term “affordable” has several meanings such that the term can obscure more than it illuminates. Nonetheless various measures confirm that New Jersey, and to a large extent our neighbors New York and Connecticut, spend a lot on housing. In particular, our lowest income citizens spend a lot of their income on housing.
We have a lot to cover in future posts. How much of this high rent/high value is connected to benefits of appropriate housing size and quality, or good locations relative to jobs and schools? What does our expenditure on housing look like when we control for those things? Can recent proposals for interventions like stronger rent controls, or more inclusionary zoning, help lower costs? How do these housing outcomes interact with the macro subjects my friend Julia Coronado is writing about, like employment and interest rates? Much to do in the months ahead! Watch this space.
Sources, and Further Reading
Aurand, Andrew, Dan Emmanuel, Sheila Crowley, Ellen Errico, Gar Meng Leong, and Kate Rodrigues. “The GAP: The Affordable Housing Gap Analysis 2016.” National Low Income Housing Coalition, 2016.
Bartik, Timothy J. “The Effects of State and Local Taxes on Economic Development: A Review of Recent Research.” Economic Development Quarterly 6, no. 1 (1992): 102-111.
Bostic, Raphael. “New Jersey Opinion: Without Affordable Options, Families in N.J. Will Continue Struggling to Make Rent.” Newark Star-Ledger, July 28, 2015 2015.
Desmond, Matthew. Evicted: Poverty and Profit in the American City: Crown, 2016.
Fink, David. “Affordable Housing Route to State Prosperity.” Hartford Courant, April 2, 2017 2017.
Fiorilla, Paul. “How the Hiccup in New York Rents Affects NJ’s Gold Coast.” Multihousing News, April 5, 2017 2017.
Flammia, Dino. “Bye Bye, Gen Y: NJ Business Leaders Fear Continued Exodus of Millennials.” New Jersey 101.5, March 21, 2017 2017.
Green, Richard K. “Property Taxes: Three Points in Favor, One Big Flaw.” Cityscape, (2013): 239-242.
Green, Richard K., and Stephen Malpezzi. A Primer on U.S. Housing Markets and Housing Policy American Real Estate and Urban Economics Association Monograph Series. Washington, D.C.: Urban Institute Press, 2003.
Guion, Payton, and Shannon Mullen. “Renter Hell (Five Part Series).” Asbury Park Press, January 5, 2016 2016.
Knopp, Elana. “Union County Summit Addresses Home Affordability.” Union News Daily2017.
MacArthur Foundation. “Pessimism About Prolonged Housing Affordability Crisis Is on the Rise, 2016 How Housing Matters Survey Finds.” 2016.
Malpezzi, Stephen. “Housing Prices, Externalities, and Regulation in U.S. Metropolitan Areas.” Journal of Housing Research 7, no. 2 (1996): 209-41.
Mather, Mark, Kerri L Rivers, and Linda A Jacobsen. “The American Community Survey.” Population Bulletin 60, no. 3 (2005): 1-20.
McDonald, John F. “Affordable Housing: An Economic Perspective.” Architecture, Media, Politics and Society 7, no. 3 (2015): 1-16.
Morris, Keiko. “Affordable Housing Heats up in New Jersey.” Wall Street Journal, March 19, 2017 2017.
Olick, Diana. “Here Are the Nation’s Healthiest — and Unhealthiest — Housing Markets.” CNBC, March 27, 2017 2017.
Olsen, Edgar O. “The Demand and Supply of Housing Service: A Critical Survey of the Empirical Literature.” Handbook of Regional and Urban Economics 2, (1987): 989-1022.
O’Neill, Erin. “N.J. Is One of the Most Expensive Places to Rent in the Country, New Study Says.” Newark Star-Ledger, May 20, 2015 2015.
Quigley, John M, and Steven Raphael. “Is Housing Unaffordable? Why Isn’t It More Affordable?” Journal of Economic Perspectives 18, no. 1 (2004): 191-214.
Rizzo, Salvador. “N.J. Supreme Court: Towns Must Have Affordable Housing.” NorthJersey.com, January 18, 2017 2017.
Short, Kathleen. “The Supplemental Poverty Measure: 2014.” Current Population Reports, no. P60-254 (2015).
Spoto, MaryAnn. “Mcmansions Are Not Affordable Housing, Judge Says.” Newark Star-Ledger, August 9, 2016 2016.
________. “N.J. On the Hook for Thousands More Affordable Housing Units, Supreme Court Says.” Newark Star-Ledger, January 18, 2017 2017.
U.S. Department of Housing and Urban Development. “FY 2016 Income Limits Briefing Material.” 2016.
Yi, Karen. “Affordable Housing Settlements Spur Housing-Seekers’ Interest.” Newark Star-Ledger, December 6, 2016 2016.
________. “Advocates Push for Housing Affordability, Rent Control in a Changing Newark.” Newark Star-Ledger, February 16, 2017 2017.