The economy is sending mixed messages
Executive Summary: The conclusion that the economy is at or close to full employment is central to the Fed’s decision to accelerate the pace of interest rate hikes and monetary tightening this year. But full employment lacks a clear-cut definition, and the severity of the Great Recession has left difficult to assess pockets of labor market slack in the form of a shadow labor force of unknown size. In a competitive labor market like the US enjoys, wage growth is the price that clears the market, and continued low wage growth suggests there may be more healing that can be accomplished before the labor market has reached its cyclical potential.
The Federal Reserve is unique among central banks around the world in that it has a dual mandate from Congress. Most central banks are tasked with achieving low and stable inflation, while the Fed must also strive to achieve “maximum employment”. Congress added the maximum, or full employment mandate during the 1970s when both unemployment and inflation were rising and legislators didn’t want the Fed to implement overly tight policy based on inflation alone. The Fed is currently facing the opposite dilemma of the 1970s, with unemployment falling even as inflation continues to fall short of the Fed’s 2% target. In order to decide the proper calibration of interest rates and monetary policy, the Fed must judge how close the US economy is to full employment. In a recent blog I discussed how a key reason the Fed is continuing to raise interest rates despite inflation that remains persistently below their target is their conclusion that the US economy is at or near full employment. In this blog I dig into the details of the labor market to see why the Fed is reaching that conclusion.
The Desert Island Indicator
The unemployment rate has long been considered one of the best indicators of where the economy is in the business cycle. Consumer spending makes up close to 70% of the economy and labor compensation accounts for more than 70% of disposable income making the labor market the most important barometer of how the economy is performing. The unemployment rate is a more useful indicator than the level of employment or the number of jobs being created each month since it accounts for population growth and the number of people at any given time who are looking for work. The Federal Reserve indicates that its mandate for full employment “is achieved when most people looking for work are gainfully employed”.
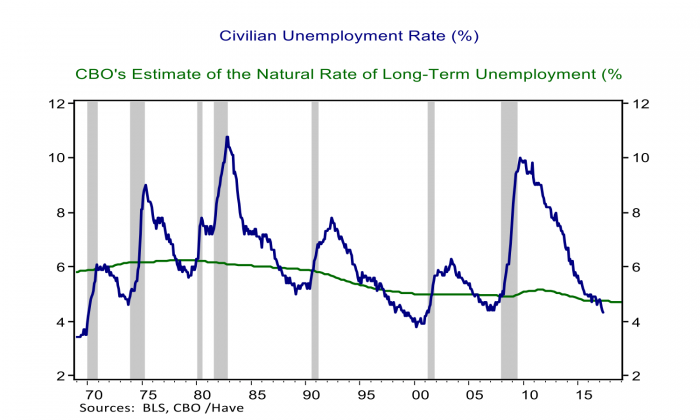
Figure 1: The US Unemployment Rate Indicates the US Economy is at Full Employment
The Fed currently sees an unemployment rate 0f 4.7% as sustainable in the longer-run and therefore consistent with its Congressional mandate. Their estimates are consistent with those of the Congressional Budget Office (CBO). The actual and estimated longer-run unemployment rates are plotted in Figure 1. The shaded areas in the graph are recessions and the graph shows that the unemployment rate rises above the longer-run rate during a recession and then declines over a number of years as the economy recovers, eventually falling below the natural rate as the recovery matures into an expansion with a healthy labor market where people who want jobs can find them. The chart also shows that even when the economy has spent years in an expansion the unemployment rate never falls to zero, reflecting that there is always some amount of frictional unemployment.
The longer-run unemployment rate is sometimes called the natural rate of unemployment. The CBO defines the natural unemployment rate as “the average unemployment rate that stems from sources other than the business cycle.” The natural rate is “determined by the rate at which jobs are simultaneously created and destroyed, the rate of turnover in particular jobs, and how quickly unemployed workers are matched with vacant positions.” Firms form and go out of business, young people enter the labor force while some older workers retire, people move around the country for a variety of personal and professional reasons, make career changes, and choices about providing care for children or other family members. All of these transitions mean that even in a thriving labor market at any given time there will be some amount of unemployment.
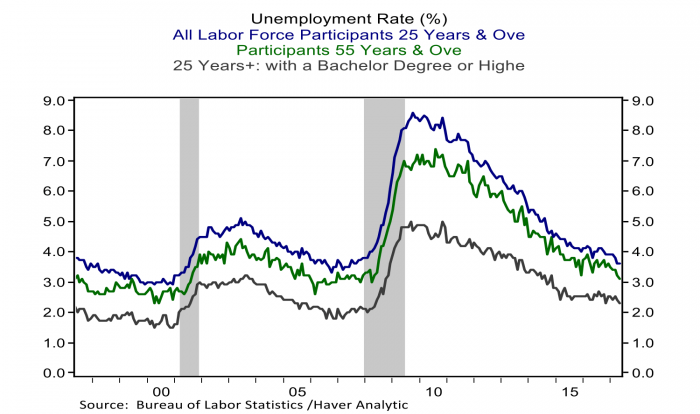
The natural unemployment rate is not known with any precisions and estimates have declined over time as the structure of the economy has changed. The CBO’s estimate has fallen from around 6.0% in the 1970s and 80s to closer to 5.0% in the 1990s to the current estimate of 4.7%. Older and more educated workers tend to have lower levels of frictional unemployment and economists at the Federal Reserve Bank of Chicago estimated that taking the aging and more educated workforce into account implied a natural unemployment rate that could be 0.5 percentage points below the CBO’s estimate. Figure 2 illustrates that unemployment rates for older and more educated workers are both significantly lower and less cyclical than the aggregate unemployment rate. The CBO has revised its estimate lower since the Chicago Fed published its research, but they still project it won’t fall below 4.7% while the Chicago researchers find it could fall to 4.5% or below in coming years.
Figure 2: The Natural Unemployment Rate has fallen Owing to an Older and More Educated Workforce
A number of other structural factors can affect the natural rate of unemployment. One measure of labor market efficiency is the number of job vacancies per unemployed person, a relationship known as the Beveridge Curve. While both measures rise and fall with the cycle, in recent years there have been far fewer unemployed people per job vacancy, suggesting the job search process may have become more efficient in recent years perhaps reflecting the role of technology. More efficient job searching and matching would imply a lower natural rate of unemployment.
Other labor market changes have more ambiguous implications for the natural rate. There has been a decline in business dynamism in recent years characterized by a declining rate at which new firms are formed and associated with declining productivity growth.[1] A declining rate of business formation and entrepreneurship could also be associated with less labor market churning and a lower natural unemployment rate but that is not a foregone conclusion since business dynamism is also associated with higher productivity and efficiency. There have also been sectoral shifts in the labor market that could affect the natural rate potentially in offsetting ways. Medical care and leisure and hospitality are two industries that have accounted for an outsized share of hiring during this recovery; the former is associated with a lower degree of turnover and the latter much higher turnover rates than average. The uncertainty in estimating the natural rate of unemployment is particularly meaningful when the economy is closing in on the estimated rate and the Federal Reserve must judge whether or not it has met its maximum employment mandate.
Coming out of the Shadows
In addition to a structurally declining natural rate of unemployment, judging whether the economy is at or close to full employment is complicated by the fact that the depth of the shock to the labor market during the Great Recession has left in its wake a shadow labor force of unknown size. The shadow labor force includes people who are either underemployed or have given up looking for work altogether, and are therefore not counted in the labor force, but who are interested in returning to work if and when opportunities present themselves. Since the shadow labor force is not counted in the official unemployment rate, Fed officials and other observers have generally judged that the unemployment rate overstates the health of the labor market in the current recovery.
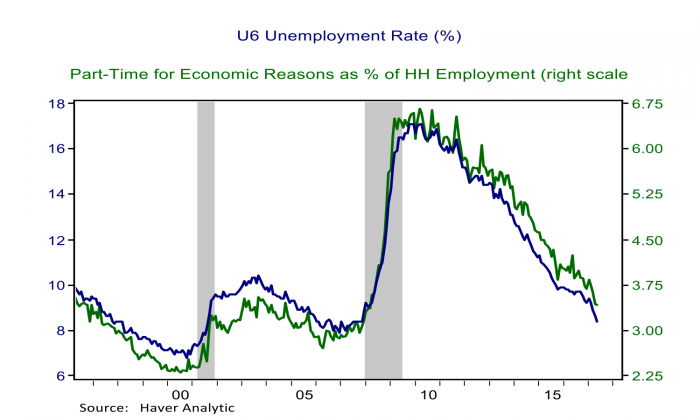
The Fed has started to rely on the broader measure of the U6 unemployment rate, shown in Figure 3, as a better gauge of the degree of unused labor resources, or labor market slack. It includes workers considered marginally attached to the labor force, defined as those who currently are neither working nor looking for work but indicate that they want and are available for a job and have looked for work sometime in the past 12 months, as well as people working part-time but want full-time work, often referred to as people who are part-time for economic reasons. The level of the U6 unemployment rate is higher than the official rate at 8.4%, but has fallen by more since the beginning of the year suggesting a pick up in the absorption of the shadow labor force and now stands at levels that were common in the strongest years of last cycles labor market. Figure 3 indicates that the share of involuntary part-time workers still has room for improvement, but it is an important sign of progress that the U6 has fallen so substantially over the past year.
Figure 3: Measures of Shadow Unemployment Are Also Improving
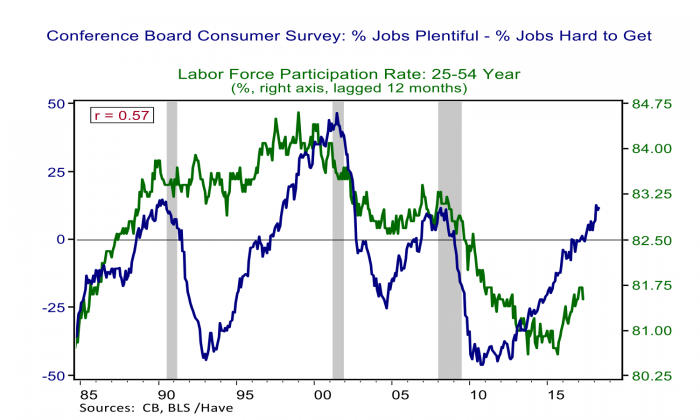
One metric of the shadow labor force that has yet to fully recover is the labor force participation rate of prime aged workers, defined as workers aged 25 to 54. This measure excludes any demographic drag on participation from aging baby boomers as well as the declining trend of teenage participation. Figure 4 plot the prime age participation rate with a 12-month lag against a measure of consumer labor market optimism from the Conference Board. The Conference Board calculates a diffusion index of the percent of respondent reporting that jobs are plentiful minus the percent saying jobs are hard to get. A cyclical relationship between consumer optimism and the participation of prime aged workers in the labor force is evident in the graph, and with consumer optimism entering positive territory for the first time on the recovery only a year ago, it seems reasonable to expect that more prime aged workers could return to the labor force if the job market continues to create a robust number of jobs.
Figure 4: A Cyclical Rebound in Participation May Have Room to Run
Trends in labor force participation across age and gender groups have fluctuated dramatically across cycles making cyclical norms difficult to define, and producing wide disagreement about the potential for further healing. On the optimistic side are Erceg and Levin (2013) who look at state level data and conclude that the bulk of the decline in prime aged participation during the Great Recession is cyclical, and that bringing these people back into productive employment will likely require “allowing the unemployment rate to overshoot its long-run natural rate”. None other than Fed Chair Janet Yellen is also on the optimistic side suggesting in a speech last fall that she found it plausible that “a tight labor market might draw in potential workers who would otherwise sit on the sidelines and encourage job-to-job transitions that could also lead to more-efficient–and, hence, more-productive–job matches.” On the other side is research by Alan Krueger and Angus Deaton and Anne Case, who find a notable rise in the number of prime aged men who have succumbed to despair, drug addiction, disability and death. Both may be true and it is a matter of finding the new equilibrium. Supporting the Krieger and Deaton and Case research is the fact that most of the cyclical recovery in prime aged participation to date has been amongst prime aged women, and it may be that reaching the full potential of the labor force would require not just allowing a tight labor market to continue, but implementing policies aimed at addressing the rising drug problem amongst prime aged men.
The Wage Canary Has Yet to Sing
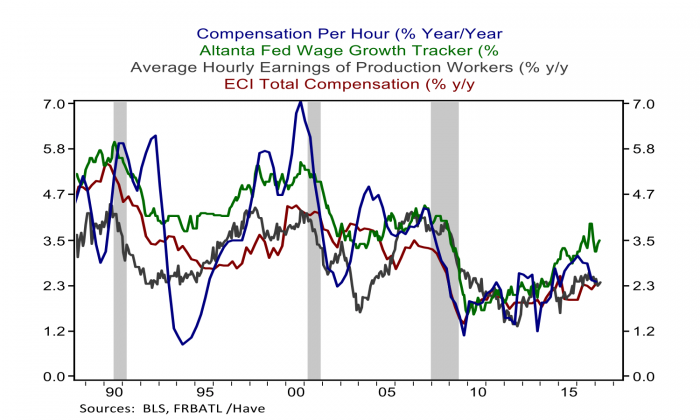
The labor market has made considerable and undeniable progress in recent years and it is nor nearly unanimous that the economy is now much closer to full employment at long last in the eighth year of the recovery from the Great Recession. A key metric that argues for continued policy patience is low wage growth. Economists look to prices to equilibrate supply and demand and wages are the price of labor. Figure 5 charts all the major metrics of wage growth across the past three business cycles, and it is hard to argue that we are getting strong cyclical indications that the unemployment rate is currently giving. There has been some progress from the lows of the cycle to be sure, but all measures remain stuck well below past tight labor markets. The signal from wage growth is corroborated in an ongoing shortfall in inflation from the Fed’s 2% target. Bond markets remain skeptical that the Fed will execute its signaled four additional rate hikes by year end 2018, and since bonds feature nominal payouts they are naturally more sensitive to signals on inflation which seemingly suggest more labor market slack and are concluding that the Fed may eventually conclude that a little less is more.
Figure 5: Measures of Wage Growth Have Yet to Signal a Convincing Cyclical Recovery
[1] See “Declining Business Dynamism: Implications for Productivity”, Ryan Decker, John Haltiwanger, Ron Jarmin and Javier Miranda, Brookings Papers on Economic Activity, September 2016.
