Signals that momentum now moves East to West
Lackluster economic data continues to flow in from around the world, and while US Q4 GDP registered a solid performance there are indications global weakness is starting to slow growth in the US. In our prior blog post I discussed the possibility that uncertainty about trade policy and geopolitical developments could lead companies to delay investment and hiring decisions. In this post I examine the contours of the current global slowdown, assess its drivers and prospects and compare it to the 2015/2016 experience when the US economy wobbled but held up. Like most ebbs and flows in the global economy this one has origins in China, although the trade conflict with the US is likely having only a marginal influence. The larger driver is an attempt by the Chinese over the past year and a half to slow the excessive credit growth that pulled the global economy out of the 2016 doldrums. Amid the deepening slowdown it appears the Chinese are reverting to the credit spigot once again, and the question is now whether it will gain traction as in 2016 or whether the Chinese private sector and consumers are saturated with bad debt. The quality of Chinese data is deteriorating in real time due to increasingly authoritarian control of information and the best indications of whether the US and global economy are likely to achieve a soft landing, a recession or a reacceleration will likely be found in company earnings guidance and the resiliency of service sector hiring. As in 2015 and 2016, the Fed won’t take risks with interest rates in the current environment, and lower mortgage rates may create an offset to intensifying global headwinds.
Momentum Now Moves East to West
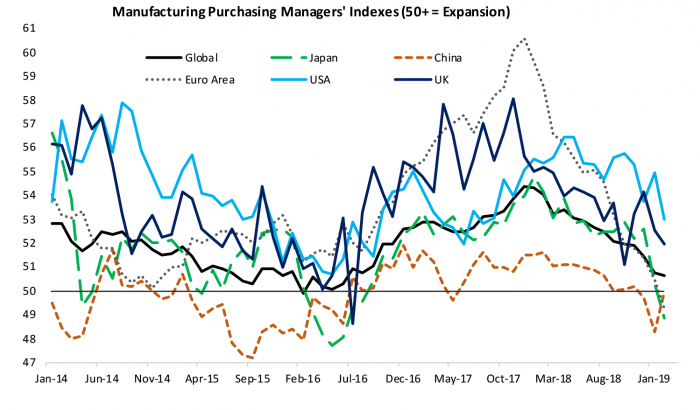
The global economy continues to shift toward services which tend to experience more moderate cyclical swings. The goods-producing sectors are more volatile and integrated into global supply chains making them more sensitive to shifts in financing conditions and global political developments. There are also timelier and better measured economic indicators from the goods-producing sectors that can provide early warning signals of the direction of global growth. Figure 1 illustrates the worrisome direction of travel of global manufacturing indicators. The global manufacturing purchasing managers’ index remained above 50, the threshold consistent with growth, but China slipped below 50 in December followed by Europe and Japan in February. The US continues to outperform, although the February reading dropped to 52.98 in February, the lowest reading since mid-2017. Given its leading role, the most recent rebound in China looks promising; however, other indicators suggest more weakness to come.
Figure 1: The Global Economy Started Slowing in 2018
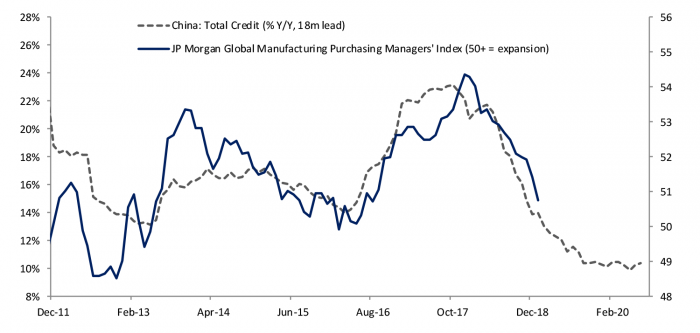
It may seem logical that the trade tensions with the US are harming the Chinese economy, and they certainly aren’t helping. However, most of the boom and bust in China and the global manufacturing chain seem more tied to an epic wave of credit growth unleashed across sectors to pull their economy out of a near hard landing in 2015 and 2016. Figure 2 illustrates the leading role of Chinese credit growth to the broader global manufacturing sector. Chinese policymakers recognized the unsustainable nature of the recent boom and have been seeking to tighten credit standards and guide their economy to a soft landing, but that is always easier said than done. The pullback in credit has been reflected in a 15% y/y plunge in auto sales, one of the few reliable data points left that allow us a direct look into the Chinese economy. The weakness in autos and consumer goods may help explain why Germany and Japan have been particularly hard hit during the current slowdown. The relationship illustrated in Figure 2 suggests additional slowing in the pipeline even given the increasing likelihood of a near-term agreement between the US and China that forestalls additional tariffs and possibly rolls back some of those implemented over the past year. The problem is domestic demand in China has become increasingly reliant on unsustainable debt growth.
Figure 2: Swings in Global Manufacturing More Tied to a Credit Boom Than Trade Conflicts
Companies Tell Us What They Are Seeing on the Ground in the Global Economy
Earnings reports from US companies doing business around the world provide an on the ground look at the health and growth prospects of the global economy. I highlighted in a previous blog that the earnings sugar rush from the tax cut was likely one reason markets were resilient in light of growing trade conflicts last year, and that profit warnings about 2019 were likely one reason the markets came back down to earth in Q4 2018. Figure 3 shows analyst earnings expectations for companies in the S&P 500 starting two years in advance and then tracing how those expectations evolve until earnings are realized. It looks like earnings for the S&P 500 will come in at a record 22% in 2018. However, through late February earnings for 2019 have been marked down to a much more subdued 5.3% with numerous companies citing weaker consumer demand in China. The pattern of downgrades looks similar to early 2015 and 2016 when earnings ended up declining for the year. During the last global slowdown, the Fed moved to the sidelines and hiked only once at the end of each year in light of volatile and vulnerable financial markets that signaled growing downside risks to the economy.
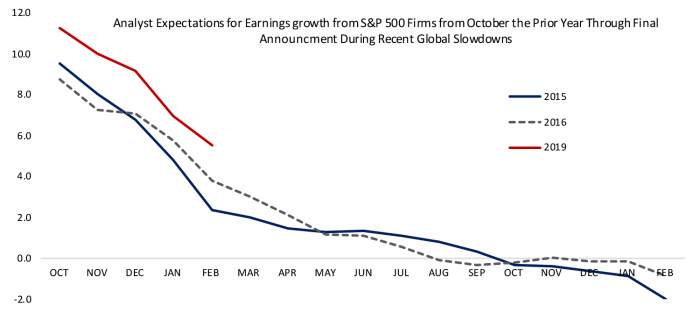
To get a sense of the dynamics of how slower growth shows up in earnings guidance, Figure 4 slices analyst expectations for 2015, 2016 and 2019 starting in October of the prior year and following through to final earnings reports, or the most recent data point in the case of 2019. It may seem that companies would want to get bad news out early, but like analysts, and generally most human beings, companies remain optimistic when faced with the uncertainties that come with gauging the impact of a slowing global economy. In the last slowdown that lasted the better part of two years, companies started guiding lower in Q4 of the prior year but continued downgrading through the year with most of the bad news released by the end of H1. The dynamic we are seeing in downgrades this year looks similar to 2015 and 2016, but earnings expectations started and remain at a slightly higher level. Continued downgrades in earnings guidance would provide confirmation that the global economy continues to slow.
Figure 3: Earnings of US Companies Affected by the Global Economy
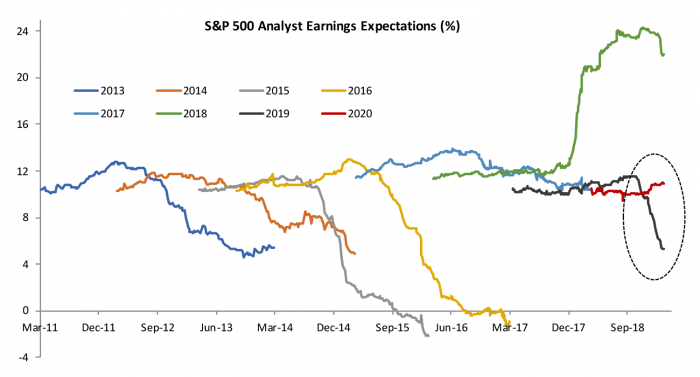
Figure 4: Earnings Downgrades Came in Fall and Spring During the Last Global Slowdown
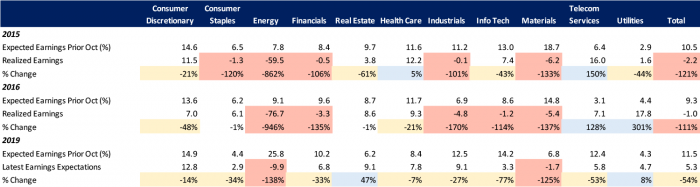
The anatomy of the current China-led slowdown is different from the last one. In 2015 and 2016 China was looking to reduce overcapacity in commodity producing sectors, as well as tame growth in leverage from the financing of commodities used as collateral. The result was a crash in a broad range of industrial commodity prices including oil, and a rapid strengthening in the dollar in part because commodities are valued in US dollars. The fact that the Fed was alone in the world in tightening monetary policy added to the upward pressure on the dollar. The commodity meltdown hurt emerging market economies and led to a number of defaults of energy companies in the US leading to a sharp pullback in energy-related investment. Figure 5 shows earnings expectations at the start of the 2015 and 2016 and final earnings by sector. Most sectors saw earnings disappointments, with concentrated pain in energy, materials, and industrial companies as well as earning declines in financials in both years, consumer staples in 2015 and information technology in 2016. To date in 2019 earnings downgrades have been more broadly based reflecting that the current Chinese slowdown is more concentrated in consumer demand this time around, although all sectors except energy and materials are still expected to register positive earnings growth. The real estate sector has seen an upgrade as a more patient Fed worries about rising recession probabilities which has lowered mortgage rates.
Figure 5: Profile of Earnings Downgrades is Different in the Current Slowdown
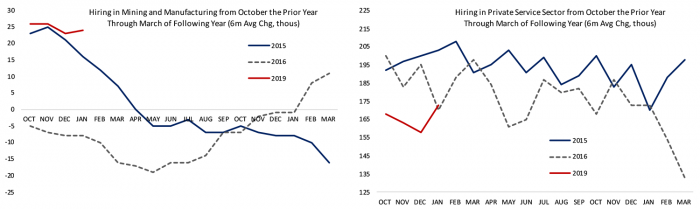
If Chinese stimulus gains traction, we should see earnings expectations stabilize as 2019 unfolds. If Chinese consumers and private sector firms are saturated with debt and therefore resistant to easing lending standards, than the broader base of recent downgrades are likely to continue. Figure 6 illustrates how the weakness in the global economy and earnings impacted US hiring in 2015 and 2016. The left panel illustrates that hiring in manufacturing and mining started 2015 on a strong footing but sank into job losses by summer with declines continuing into late 2016 when the global economy started to rebound. The right panel shows that the private service sector continued to add jobs at a solid clip throughout the episode, buoyed by strong consumer spending on the back of plunging gas prices that boosted purchasing power. I would expect the current strength in manufacturing hiring to fade as the year progresses and will look to resilience in private service sector hiring as the bellwether of broader US resilience. Consumers are not enjoying nearly the same tailwind from plunging gas prices but are enjoying stronger wage growth suggesting they may spend at least moderately through the current uncertainty and keep the domestic service economy on track.
Figure 6: Goods Hiring Should Slow, Watch for Service Sector Resilience