
The tides of Northern New Jersey residential prices since the crash and Sandy
As we arrive at the 5-year anniversary of Hurricane Sandy, and have also passed the 10-year mark since the bursting of the housing bubble, it seems like a good time to take a step back and see how residential real estate values have evolved since then. Have prices recovered? Which had a larger impact, the Great Recession or the superstorm?
The negative effects of the recession in this case are clear: the combined forces of the economic recession and the drying up of mortgages put tremendous downward pressure on prices. Simply put, the demand for real estate melted away, generating a glut of properties, which could only be sold at steep discounts. But this leads to the questions of how much value was lost during the downturn, and how long did the slump last?
The effects of the Sandy storm surge, however, are less clear. When Sandy hit, it generated several competing market forces. On one hand is the “negative demand effect”; that is, the surge damaged properties and made them less valuable as a result. Furthermore, both within and near the surge area, the storm represented an informational “shock” that these neighborhoods are, in fact, vulnerable to flooding, which likely put further downward pressure on prices.
On the other hand, when the surge hit, it reduced the supply of housing in different neighborhoods because it either destroyed entire properties or made them unavailable for sale until they were repaired; this would create upward pressure on the remaining structures (a “shortage effect”).
Sandy and Northern New Jersey
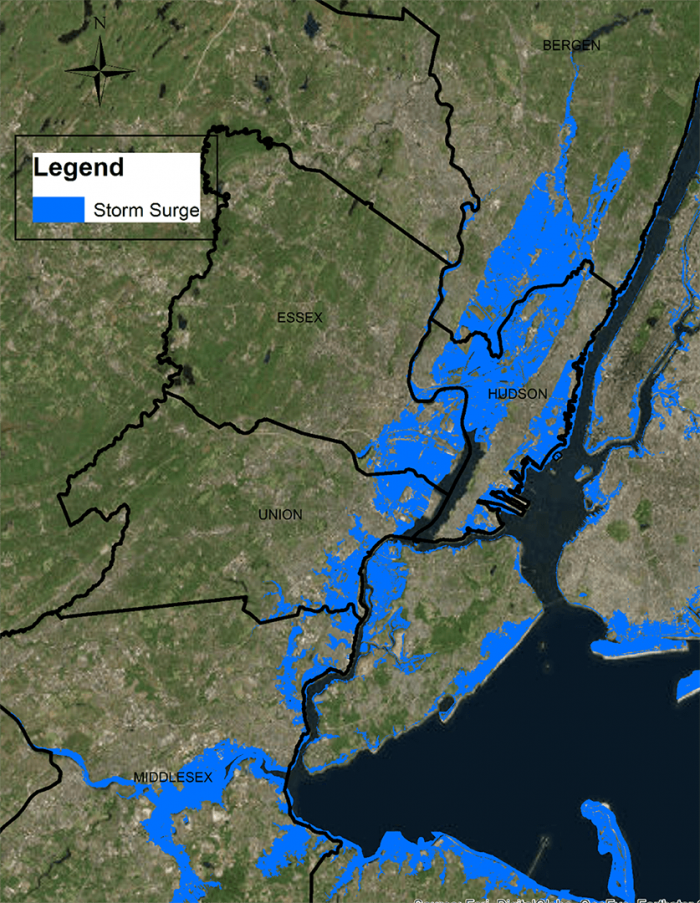
Media accounts of the hurricane in New Jersey have tended to focus on the Jersey Shore, with images of Governor Christie walking along the ruined boardwalks promising to rebuild. Perhaps less well documented is the fact that northern New Jersey also experienced significant flooding (see Figure 1). Our interest is to explore the impacts of the storm on those counties that are not directly facing the Atlantic Ocean, but rather are adjacent to New York Bay and the Passaic and Hackensack River estuaries.
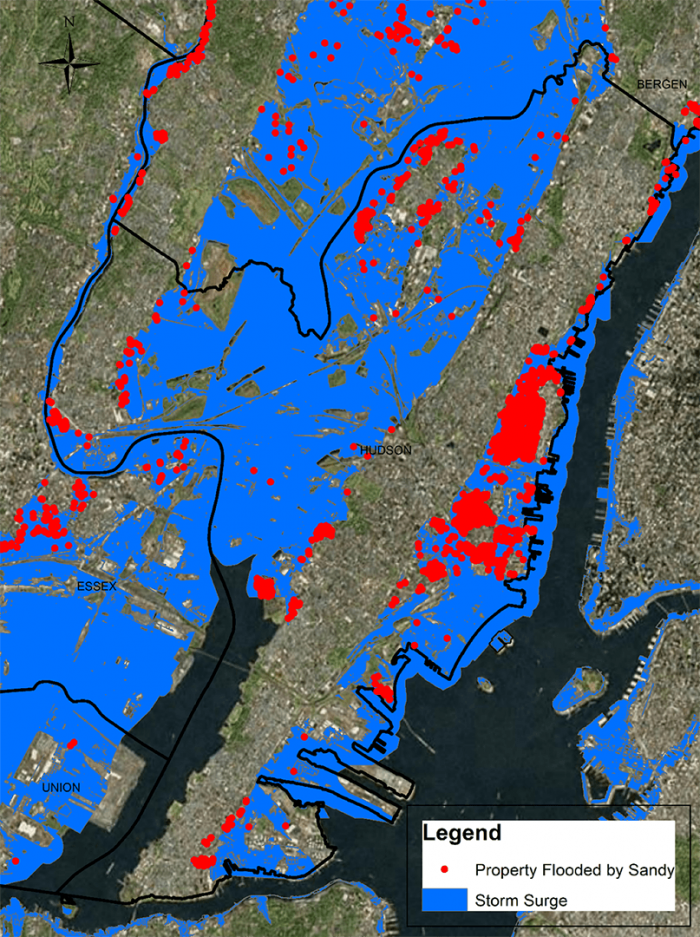
Consider Hudson County, a kind of peninsula sandwiched between New York Bay and the Hackensack and Hudson Rivers. During the storm surge, it received a blow from both sides. Only the higher ground in the middle of the county was spared from flooding, as shown in Figure 2.
Even less discussed was the impact on Newark, in Essex County. Roughly half the land area of the city experienced some flooding. The immigrant enclave of the Ironbound neighborhood in Newark was particularly hard hit.
Findings
To investigate both the housing bubble and the net Sandy effect, we obtained a large data set on housing sales throughout New Jersey provided by Zillow.[1] Using this data our goal was to produce an inflation-adjusted real estate price index from 1994 to 2016 with a focus on five northern New Jersey counties: Bergen, Essex, Hudson, Union and Middlesex. We performed a statistical analysis that allowed us to look at values over time, controlling for a host of property-specific and location-based factors.[2]
Figure 3 presents the index results based on over 588,000 transactions for the five counties. Several things stand out in the figure. First, in the 1990s, real prices in New Jersey were virtually flat. The 1994Q1 index value was 100 and by 1999Q2 it was only a 103. Then prices began their step ascent with a peak value of 218.5 in the third quarter of 2006. In this period of rapid appreciation, the average inflation-adjusted growth rate was 10.4% per year.
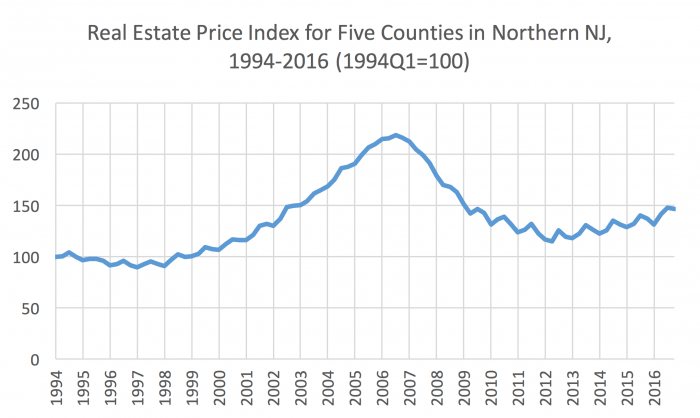
Then the bubble burst. Prices finally stabilized four years later in early 2012 (with its trough value at 115); they began to rise from there. Then Superstorm Sandy arrived. However, the figure shows that, on average, across the five counties, there is very little evidence of a Sandy effect. This is likely because the vast majority of properties were not directly impacted by the storm.
To tease out how Sandy might have influenced prices, we then focused only on those properties that were either flooded or were relatively close to the coast (looking at two subsamples—those within three miles of the coast and those one-half mile away).
Furthermore, we performed a pairwise statistical analysis for properties that were in the flood zone (both before and after the actual flooding) and a similar exercise for those properties not the in flood areas.
First, we looked at how prices were determined over time using the same basic set of controls we used to get the results in Figure 1 (but only looking at properties that were in the flood zone—both before and after the actual flood). It’s important to note that the control variables also included the property elevation, the distance to coastline and whether or not the property was in a FEMA-designated floodplain. This analysis essentially assumes that the storm never happened.
Next, we performed a second analysis by altering the control variables to consider the fact that, after the flood, the value of being on higher and being further from the shoreline might have increased because of its relative safety; we also controlled for the depth of the surge and that the properties were flooded by the storm. We then compared the year-quarterly index values from the first analysis to the second.
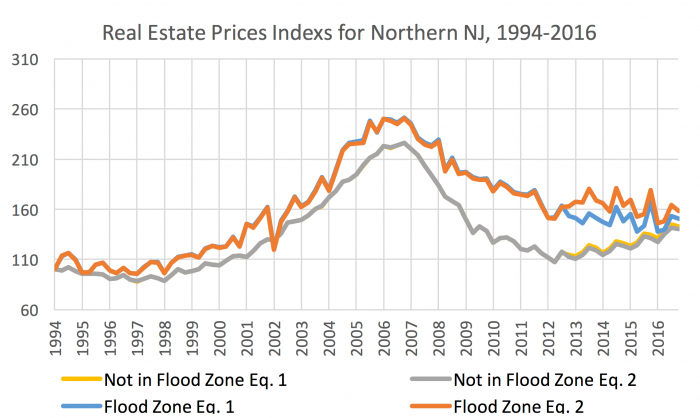
Figures 4 and 5 present the results of the analyses. Figure 4 shows four indexes from 1994 to 2016. “Flood Zone Eq. 1” is the price index that “ignores” the storm. “Flood Zone Eq. 2” controls for the effects of Sandy. The two indexes are virtually identical until the storm (as would be expected), and then the indexes split. This split reflects the storm’s damage and its effect on prices over time. In short, the difference between the two can be interpreted as the net effect of Sandy on housing prices in the flooded area.
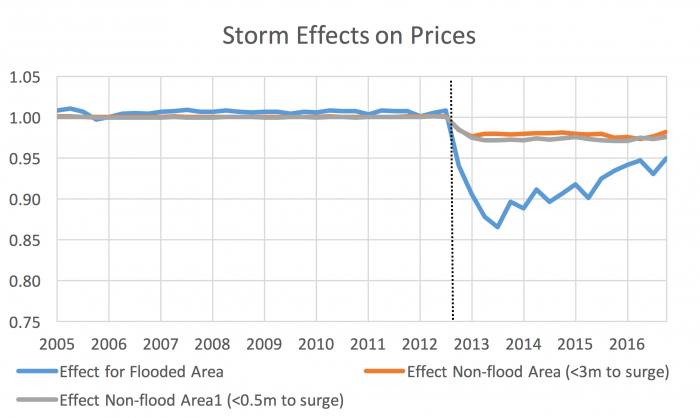
Figure 5 telescopes onto the differences by looking at the ratio of the two indexes, and demonstrates that just after the storm prices dropped by 13%, on average, but have recovered since then. The recovery reflects the rebuilding.
Returning to Figure 4, for the non-flooded properties, the graph does not reveal a clear split in the two indexes. But, again, telescoping onto the difference in Figure 5 suggests that properties that were within three miles of the surge actually experienced about a 2% drop in prices. This drop likely reflects the psychic harm of being near the surge. The measured effect is about 3% for those properties within a half mile of the surge. Further, this “psychic effect” does not seem to have dissipated over time.
In conclusion, the combined effects of the bubble and the surge have hit northern New Jersey quite hard. The bursting of the housing bubble was particularly fierce in that from peak to trough prices dropped by 47%. The net effect of the storm was only about 2-3% for dry properties, on average, and an initial 13% average drop in the surge area, but with significant recovery since then. The sustained economic growth of the Northern New Jersey-New York City metropolitan area, however, has acted as a counterweight to these downward forces, and, on balance, housing prices have continued to rise over the last few years.
[1] Data provided by Zillow through the Zillow Transaction and Assessment Dataset (ZTRAX). More information on accessing the data can be found at http://www.zillow.com/ztrax. The results and opinions are those of the authors and do not reflect the position of Zillow Group.
[2] To be specific, we ran a regression of the real price per square foot of each property on a set of building-specific controls (e.q., square footage, lot size, building age, land-use dummy variables, zip code dummy variables, elevation, distance to the coast, a FEMA floodplain dummy, and year-quarter dummy variables for the sale date). Results are available upon request from the authors. Note that real estate prices were first adjusted to real values using the Consumer Price Index for NYC-Northern NJ excluding shelter costs.