The short answer, yes. And with the loss of SALT deductions, property tax may cost the state even more
Property taxes paid by homeowners in New Jersey seem to me to be at least 30% too large relative to property taxes paid by homeowners in other, nearby, similar states. Measured at the median home-owning household, I will show you some back of the envelope calculations that make it appear as if property taxes are too high by at least $1,800 per year. Given there are approximately 2 million home-owning households in New Jersey, if I am correct this implies our local governments overspend by at least $3.6 billion dollars per year of property tax revenue. With a slight change in assumptions, a strong case can be made that we overspend more than $5 billion dollars per year, every year.
The rest of this blog details how I came to this conclusion.
The Current Population Survey (CPS) is a large sample of data with detail on geography, household income and property taxes paid. The government uses the CPS to calculate the unemployment rate and other statistics. I use the CPS data over the years 2010-2015 to discuss property taxes. In my calculations, I restrict CPS data to homeowners that report positive income. To give you an idea of sample size, for New Jersey from 2010-2016 there are 5,590 households in my sample of CPS data.
For every state in the country and the District of Columbia, in my CPS sample I compute (a) the median of the reported annual property tax, (b) median of household income and (c) the 25th, 50th, and 75th percentiles of the ratio of property tax to household income. Studying the ratio of property tax to income is useful because it shows how much income people have to forego to pay their property tax bill. It also automatically corrects for the fact that incomes, including wages of government employees, are simply higher in some states than in others. [Minor statistical aside: The median of the ratio of tax over income does not have to equal median tax divided by median income].
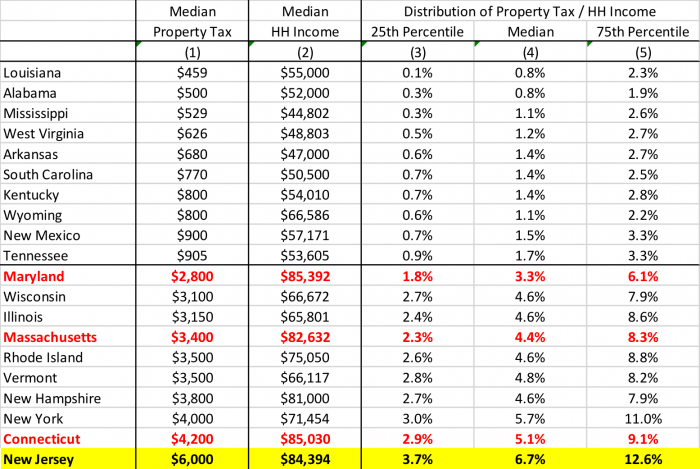
Table 1 below shows results for the top-10 and bottom-10 states when sorted by median property tax paid. In New Jersey, the median homeowner pays $6,000 per year in property tax (column 1). This is more than six times what homeowners in the bottom ten states in the US pay. Now an argument can be made that the lowest-property tax states have much lower incomes than New Jersey (column 2), so we should expect to pay more. Additionally, since our incomes are higher, we may have different norms and expectations: We may demand better and more expensive public schools and local public services than those other states.
Column (4) therefore shows the median of the ratio of property tax to household income. Measured this way, New Jersey has the highest property tax rate in the country at 6.7 percent of income – and it is not close. The property tax rate for the median U.S. state is 2.6 percent of income, less than half of New Jersey’s rate. The next highest property tax rate to New Jersey is New York at 5.7 percent of income. Even Connecticut is 5.1 percent of income, nearly 25% lower as a percentage of income. Columns (3) and (5) show that the property tax rate in New Jersey is relatively high for all homeowners.
Table 1: Top- and Bottom-10 US States by Median Homeowner Property Tax
What I find most alarming about the data in Table 1 is that we spend much more as a percentage of our income than states that I consider to be good substitutes in terms of incomes, employment opportunities, education and political attitudes: Connecticut, Massachusetts, and Maryland. I define waste simply by comparing New Jersey to these three similar states. Treating Connecticut as our aspirational state for frugality, we waste nearly $1,800 per household in property tax per household ($6,000 in New Jersey as compared to $4,200 in Connecticut), translating to at least $3.6 billion dollars per year in total in New Jersey. If we were to define waste by comparing ourselves to Massachusetts or Maryland, the outlook is grim. Relative to Massachusetts, we overtax by $2,600 per household, translating to $5.2 billion wasted statewide. Compared to Maryland, the estimate is $3,200 per household and $6.4 billion in total across the state.
Think about this: If our local governments spent the same fraction of income as Connecticut, we could take the excess $3.6 billion in yearly property tax revenue and fund our pensions; or we could repair our railroads; or, over the course of a few years, we could fund much of the required renovations and construction for the train tunnels to New York City.
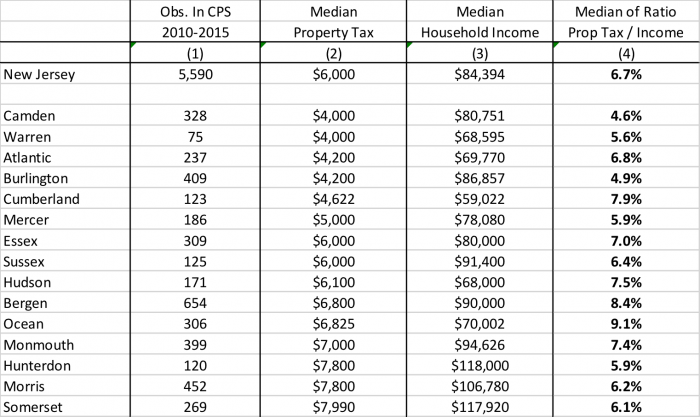
Table 2: Property Tax and Income Statistics for Counties in New Jersey
One question that comes up is whether the estimates for New Jersey in Table 1 are somehow skewed, despite using the median as an estimator, because certain very-high-tax counties are distorting the estimates. To address this, Table 2 (bellow) shows results from the CPS for most of the counties in New Jersey. The accounting is not complete as certain counties are not identified in the CPS and sample sizes for other counties are so small that I did not consider the estimates to be reliable.
Column 1 of Table 2 shows CPS sample sizes for each county to highlight that samples are not large and estimates in this table may be a little noisy. With that caveat in mind, the overall picture emerging from Table 2 is clear. Property taxes in levels, and as a percentage of incomes, are high everywhere in New Jersey. Consider Camden County, the county with the lowest property taxes in New Jersey. The median homeowner in Camden County pays just five percent ($200) less than the property tax paid by the median homeowner in Connecticut.
A number of my Executive Committee members have asked me to look at property taxes as a percentage of home value, across states and within New Jersey, to see if the same story emerges. For this analysis, I turned to data from the 2015 American Community Survey, which contains information on both property taxes paid and owner-assessed house value (which, historically, has been found to be accurate within a few percent). The sample sizes in the American Community Survey are very large – for example, there are 115,203 respondents for New Jersey homeowners alone – but the property tax data are “binned” and thus a little noisy and further the reporting of property taxes is top-coded at $10,000 per year, i.e. when respondents report property tax payments greater than $10,000, the data are coded at exactly $10,000.
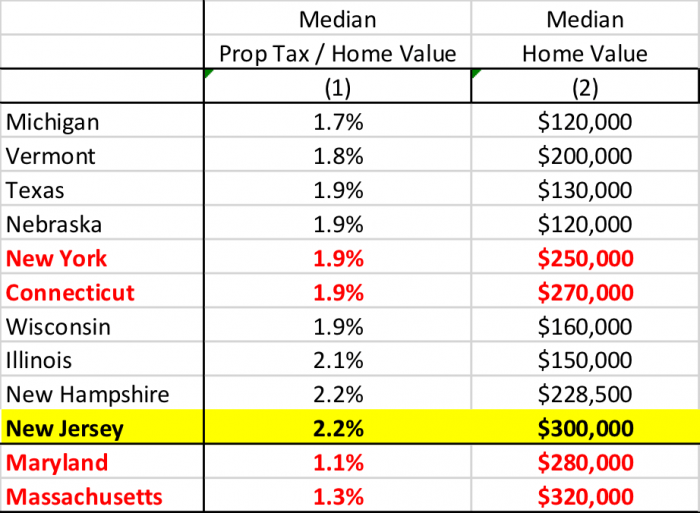
With those caveats, for each state I compute for all homeowners in the sample the property tax rate (property tax / home value) and then pick out the median of that ratio. Table 3 reports the 10 states with the highest median property tax rate along with the median value of owned homes; at the bottom of the table I list the property tax rate and median value of housing for the comparison states of Maryland and Massachusetts. The median property tax rate across U.S. states is 1% (not shown) and states like Delaware and Colorado have a property tax rate of 0.6%. As you can see from the table, New Jersey has the highest property tax rate in the country at 2.2%. It is true that places like Texas and Wisconsin have high property-tax rates, but house values are much lower at $130 and $160 thousand, respectively, such that the property tax burden out of income for residents in those states is not that large. Our property-tax rate would need to fall by roughly 15% to equal that of Connecticut or New York. And relative to both Maryland and Massachusetts, our property tax rate is much higher – double in the case of Maryland.
Table 3: Bottom-10 US States by Median Homeowner Property Tax
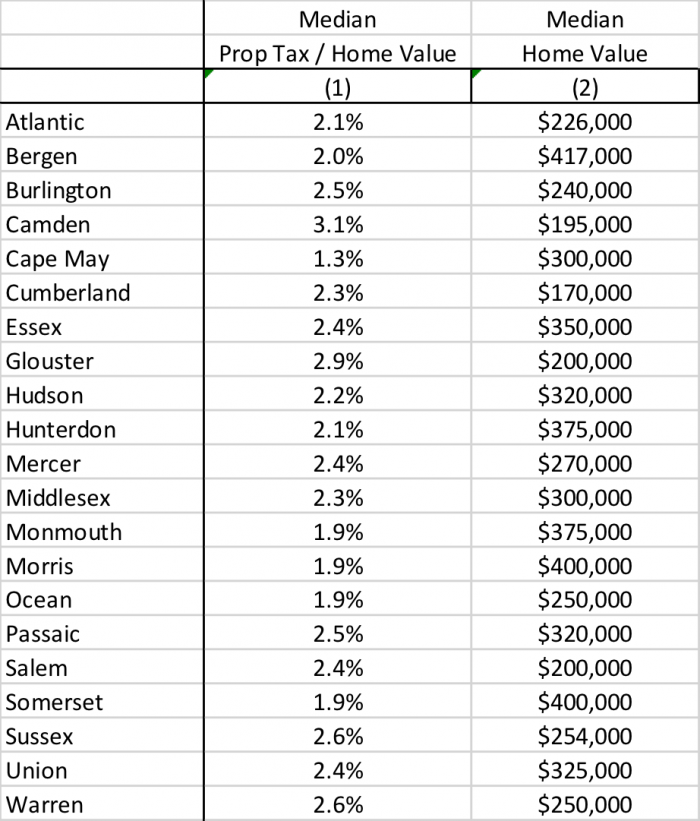
Out of curiosity, I computed the median property-tax rate and median value of owned housing for each county in New Jersey. Those data are shown in Table 4. Except for Cape May County, the median property tax rate ranges from 1.9% in Monmouth, Morris, Ocean and Somerset Counties to 3.1% in Camden County. Property tax rates are high everywhere in New Jersey.
Table 4: Property Tax and House Value Statistics for Counties in New Jersey
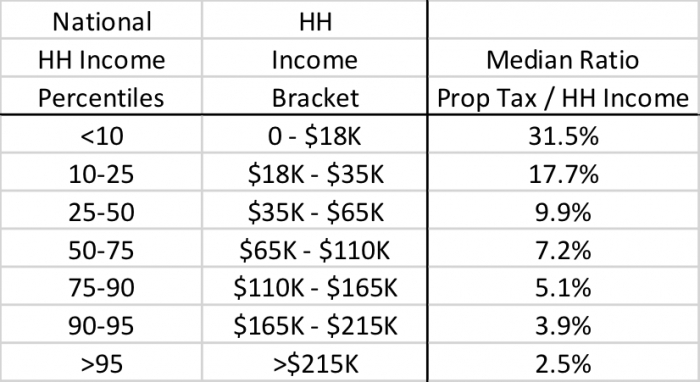
I’d like to conclude by providing a perspective on property taxes that you may not have heard before. Property taxes are regressive: People with lower incomes pay higher property taxes as a percentage of their income. Table 5 shows the median property tax paid relative to household income, by income bracket, for homeowners in New Jersey. The boundaries of the income brackets were chosen to match the 10th, 25th, 50th,75th, 90th and 95th percentiles of the nationwide distribution of household income as measured in the CPS. The table clearly shows that as incomes rise, households dedicate a lower percentage of their income to paying their property taxes. Homeowning households with incomes less than $18,000 per year pay more than 30% of their income to their property tax bill in New Jersey; whereas households with incomes above $215,000 per year only 2.5% of their income in property taxes.
Table 5 – Property Tax as a Percent of Income, by Income Bracket, for Homeowners in New Jersey
The property tax is regressive for two key reasons. First, retirees with low incomes may own expensive homes. The value of their home reflects their income while working, not while retired. This high property tax burden is one reason why retirees have incentives to leave New Jersey. Second, and importantly, in a cross-section of people, the value of housing does not rise one-for-one with income. As people get richer, the value of housing they purchase does not rise at the same rate as their income.
So what can be done? Should anything be done?
Change is difficult. And I think many people (rightfully) believe that if we lower property-tax revenue, the quality of our local schools and other public services might suffer. So the response to date has been to do nothing. But, keep in mind a few things. First, states like Colorado, Maryland, Massachusetts, Virginia, etc. have, in many places, good public schools and good public services. Can we justify why we spend more? Second, doing nothing seems to me to be a risky long-term option. After the change in the Federal tax code eliminating much of the deductibility of state and local taxation, many residents of our state should expect an increase in their Federal tax payments. With this added tax burden, we risk that higher-income residents will increasingly leave the state; and a sustained outflow of high-income, high-taxpaying residents might push the state into an even worse financial situation.
