A maturing auto cycle signals an increasingly precarious outlook
The auto sector is one of the most interest-sensitive sectors of the domestic economy, thereby amplifying business cycles around turning points. Next to real estate, auto sales are the most adversely affected by rising interest rates, with sales turning down historically 12 to 24 months prior to the end of an expansion. As such, the auto sector can be a good leading economic indicator. Declining demand accelerates during a downturn, then responds early when the Fed lowers rates adding momentum to a recovery. The US auto sector has embodied the challenges facing the broader economy this cycle. The sector experienced a crisis, not a recession in 2009 with two of the big three automakers turning to the government for life support. An improving economy and a recovery in financing allowed the sector to play its usual role in supporting the recovery. More recently the sector faces cyclical and structural challenges in the form of a maturing finance cycle and a stronger dollar, as well as tariffs and the need to invest in electrified, connected and automated vehicles at a time when revenue growth is waning. Automakers must make decisions amid a challenging and cloudy environment. The pressures were in evidence recently when General Motors announced it will shutter five factories in North America and cut about 14,000 jobs. Ford has also indicated a sizable global restructuring plan is in the offing but hasn’t provided details on layoffs or locations of affected operations. The sector won’t be the cause of the next downturn, but recent announcements and data confirm that we are entering increasingly fragile territory.
Auto demand is a leading indicator of business cycles
The motor vehicle sector is not usually the catalyst for business cycle downturns, but it is a leading indicator of recessions and a pro-cyclical sector that amplifies economic swings. Aside from housing, autos are the most expensive durable item consumers purchase. Data from Experian indicate that 86% of new vehicles and 55% of used vehicle purchases are financed making auto demand sensitive to interest rates and credit conditions, as well as to labor market conditions and consumer sentiment.
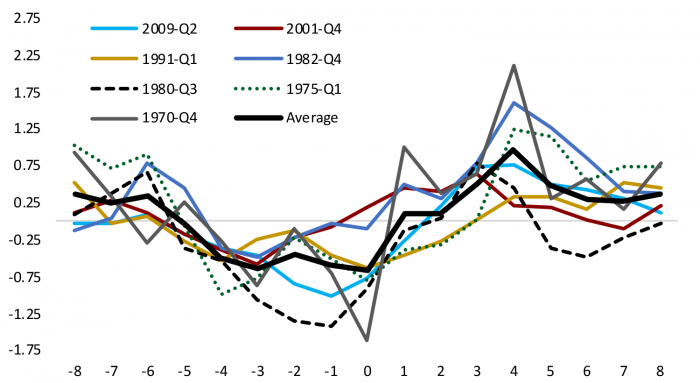
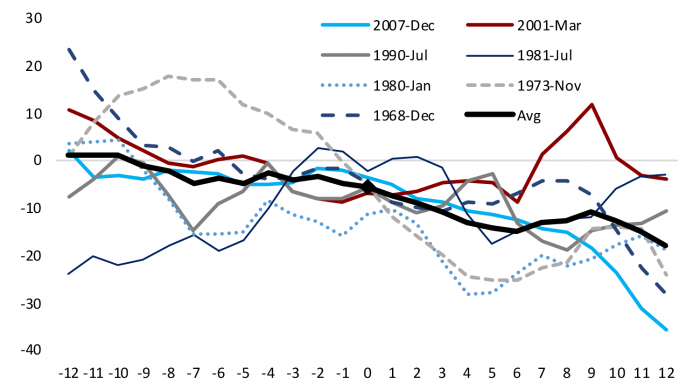
Figure 1 – Light Vehicle Sales Per Capita in Months Before and After Business Cycle Peaks
(% chg 6-month annualized rate, 0 = business cycle peak)
Auto demand can be thought of as having a cyclical component on top of a structural foundation tied to population growth and preferences plus replacement associated with the scrapping of old vehicles. When a downturn hits, credit tightens, and the labor market weakens, consumers postpone auto purchases. As the Fed cuts rates, those who have jobs take advantage and start buying cars again. Pent-up demand leads sales to run above trend for a time, then as the cycle matures auto sales slow and the sector becomes a neutral to slightly negative force on GDP.
Figure 2 – Contribution of Motor Vehicle Sector to Real GDP Growth Around Business Cycle Trough
(percentage points 4-qtr avg, 0 = business cycle trough)

Figure 1 shows that auto sales per capita start declining nine months before the peak of post-war business cycles on average. Interest-sensitive sectors respond first to tighter monetary policy and tend to become a slight drag on growth before a recession hits. At the peak of the cycle auto sales have been declining an average 5.5% over the past year. As of November this year, auto sales per capita were falling 3% at an annualized rate. There are no signs of a sharp retrenchment in auto demand currently, rather it appears that smoothing through some spikes in sales tied to hurricane replacement demand auto sales peaked in 2015 and have been gliding toward replacement demand which we estimate at 15.5 million units per year. Figure 2 shows the contribution of the motor vehicle sector to GDP around cycle troughs. The auto sector subtracts around 0.7pp per year from GDP at the depth of a recession and contributes an average 0.4pp per year in the first two years of a recovery as lower financing costs and pent-up demand propel the recovery.
Last cycle was a crisis, not a recession
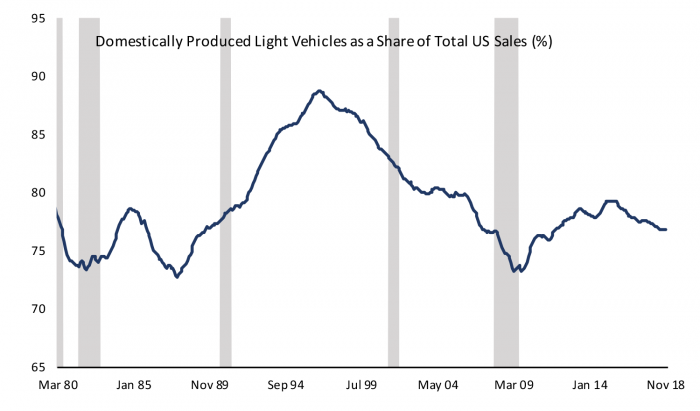
The 2009 recession was far worse than an average cyclical downturn for the US auto industry. Years of declining competitiveness was compounded by a collapse in financing leading to a government-funded rescue of two of the big three US automakers, as well as financial support for suppliers and dealers. Figure 3 shows that after realizing a surge in market share with the introduction of sports utility vehicles in the 1990s, US automakers steadily lost ground to imports in the years leading up to the Great Recession. The chart overstates the market share of the big three US manufacturers as it includes all vehicles produced in the US and foreign auto companies have been building plants in the US in recent decades.
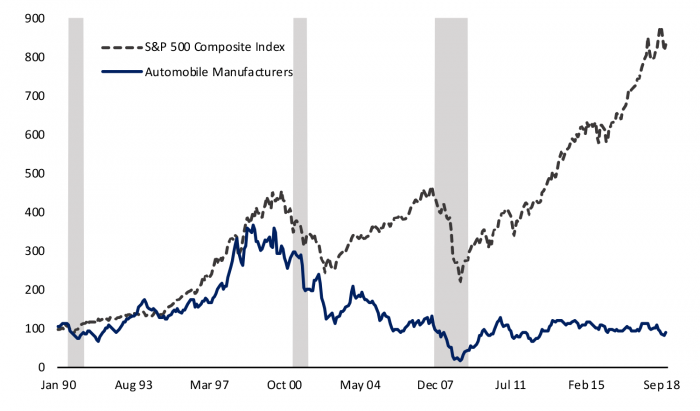
The underperformance of US automakers is also illustrated in Figure 4 which shows the S&P 500 Composite Stock Index and the index for the valuation of US automakers, both indexed to 1990. The US auto industry nearly kept pace with the broader stock market in the late 1990s but then suffered years of underperformance; in the current cycle US automakers have not participated in the climb to record valuations enjoyed by the S&P 500 and barely recovered the subdued valuations that prevailed just prior to the financial crisis. The car companies have restructured and streamlined their operations, cut their cost structures and returned to profitability. Chrysler exited its government bailout arrangement in 2011 and General Motors exited in 2014. However, valuations by investors suggest ongoing caution with an average price to earnings ratio for auto manufacturers of around 12 in Q3 2018 versus close to 22 for firms in the S&P 500 as a whole.
Figure 3 – US Automakers Have Lost Share to Foreign Producers
Cyclical Challenges on the Rise
The auto industry is now confronting a number of headwinds, some cyclical and others structural. Vehicle sales have averaged 17.2mn at an annual rate so far this year, on par with the pace registered in 2017 and down only modestly from the peak rate this cycle of 17.5mn realized in 2015 and 2016. Sales have likely been boosted by more than 1mn over the past two years by replacement demand for autos in the aftermath of a series of hurricanes and wildfires. Figure 5 highlights that per capita auto demand appears to be moderating toward the underlying replacement demand as the cycle matures, and in the absence of a similar pace of destruction from natural disasters in 2018 we could see a greater moderation in sales toward an underlying pace of replacement demand closer to 15.5mn (although as I wrote in my last post, destruction from natural disasters related to climate change is likely to intensify on average in coming years).
Figure 4 – US Automakers Have Underperformed the Broader Stock Market
Domestic manufacturers have had to grapple with a headwind from a dollar that has appreciated more than 20% on a trade weighted basis since mid-2014 and more than 10% against the Japanese Yen. Figure 3 highlights that domestic manufacturers have lost market share in the past three years after recovering some lost ground early in the recovery. A stronger dollar has been accompanied by lower gas prices, on balance, and consumers have shifted toward a preference for imported trucks and crossovers over fuel-efficient domestic cars. Even as overall auto demand has moderated, domestic car sales have declined 30% since 2015 while imported trucks, primarily from Japan and South Korea, have more than doubled forcing domestic car manufacturers to restructure production plans.
The financing cycle is also maturing. As the recovery took hold auto finance companies aggressively pushed out the credit spectrum expanding their market with subprime auto lending. However, the subprime auto market looks tapped out as data from the New York Fed shows that serious delinquencies on auto loans have been rising steadily since 2015. Lenders have responded by tightening credit standards with the median credit score on a new auto loan rising to 704 in Q3 2018 from a low of 683 reached in 2015.
Figure 5 – Auto Demand Moderating as the Cycle Matures
On top of natural cyclical pressures, automakers have been at the epicenter of pain from tariffs on steel and aluminum and uncertainty from disruptions to existing trade relationships. Automakers have struggled to pass along rising input costs from tariffs as a maturing leasing cycle means they are competing with a glut of supply in the used car market. Both new and used car prices have declined around 0.5% over the past year despite rising input costs for auto manufacturers in the face of softening demand and plentiful supply.
Structural Headwinds: Technology Disruption from the Promise of “New Mobility” and Trade Wars
All automotive manufacturers – and suppliers – are gearing up for a major transition in the sector as the economics of electrified, connected, and automated vehicles become commercially viable. GM, Ford, and other manufacturers are announcing restructurings, even as sales remain at a relatively high level in their most profitable SUV and trucks segments, because new investments need to be made in order to keep up with the changing mobility landscape. Battery costs for electrified vehicles (plug-ins and pure battery electric) have come down and are slated to be price competitive in the 2020-2025 period. Assembly lines to produce EVs take up one-half the footprint of the traditional factory. New companies are nipping at the heels of the traditional manufacturers; China has over 100 EV startup companies and their factories produce battery cells at scale. Transportation network companies, like Uber and Lyft, are also committing to software that automates many driving functions. US automakers need to free up cash for investment, which is particularly challenging with the auto cycle now turning down and revenue growth poised to slow.
Auto makers face an elevated level of uncertainty around the rules that govern existing trade relationships that are unlikely to be resolved quickly. A tentative agreement has been reached on restructuring the North American Free Trade Agreement, but it still must go through the Congressional approval process which is likely to take the better part of next year and bring some changes to the negotiated agreement. Meanwhile the Trump Administration is in the midst of a section 232 process with regard to auto imports with the findings set for release before mid-February. Section 232 of the Trade Expansion Act allows the Administration to impose tariffs on imports if they pose a threat to national security. If the Administration finds such a threat, which is likely, the President will have 90 days to decide on tariffs. Section 232 is being used as a negotiating tactic with a focus on European car makers.
The motor vehicle sector has neither added nor subtracted from GDP growth thus far in 2018, although it has added nearly 12,000 employees mostly in heavy truck and auto part production. US Automakers must make decisions about production and investment amid an increasingly challenging environment and the recently announced restructuring plans combined with waning demand suggest the sector is likely to be a modest headwind to growth in 2019.