
The complex role of immigration in our cities
Executive Summary: Overall the benefits of immigration, like the benefits of foreign trade, are positive and robust. Another similarity with trade is that there are often some losers as well as many winners. Building on two recent posts on immigration by Julia Coronado, in this post we examine some additional basic facts and definitions, and survey some key results about immigration’s effects on urban labor markets, the housing markets of cities, and local public finance and governance.
Introduction
Immigration is such a red-hot topic that any day’s search of the news over the past 20 years will find dozens if not more stories – about changes in laws and policies, authorized and unauthorized/illegal immigration, immigration and employment, immigration and wages, immigration and crime, the “Dreamers,” refugees from violence in every continent, and the like.
Unless you live in Kenya, and your family has lived there for about 200,000 years, we’re all immigrants, or descendants of immigrants. We’re still learning about the history of our species overall, though archeological and biological evidence points towards human origins in East Africa, spreading through the rest of the world over many thousands of years (Ayala et al. 2017, Harari 2014). Did the first North Americans cross the Bering Strait when it was a land bridge, or make a long perilous sea journey, possibly landing in South America first? Not my area of expertise, so I won’t delve into this long and not totally settled history any further here.
Our focus today is more recent immigration. As I write, the top of today’s online news search alone turned up, copied here in no particular order, “Visa Overstays Now Biggest Problem in Illegal Immigration,” “The Perils of Immigration Federalism,” “MS-13 Raids: More than Half Illegal Immigrants,” “Trump Cites MS-13 in Immigration Crackdown. But Others Here Illegally are Helping Police Bring Down the Gang,” “Immigration Reform Catalog: 20 Changes to Improve U.S. Immigration Policy,” “Haitian Temporary Protected Status Extended for Six Months by Trump Administration,” “Immigration Arrests are Swamping the Court System,” “Trump Crackdown has US Latinos Too Scared to Spend,” “Americans Back Immigration and Trade at Record Levels,” “What an Immigrant Murder in Kansas Says About America,” “How to Woo Chinese Investors: With Visa Offers and the Trump Name,” “Re-Reconsidering the Mariel Boatlift,”and “Could Immigration Save Youngstown?” So I’ll take everyone’s interest in the subject as a given.
As my fellow Rutgers Real Estate blogger Julia Coronado showed previously, America’s foreign-born population declined as a percentage of U.S. population in the first half of the 20th century as the restrictive Emergency Quota Act of 1921 and the follow-on Immigration Act of 1924, also known as the Johnson-Reed Act, kicked in. Johnson-Reed limited annual immigration from each country to 2 percent of the number from that country living in the U.S. according to the 1890 Census, i.e. before much of the large waves of Italian and other southern/eastern European immigration at the turn of the century. Jewish immigrants (many of whom were from Eastern Europe), Africans, Asians and Latin Americans were among those effectively shut out. Overall, the share of U.S. population born abroad fell from around 15 percent a century ago when Johnson-Reed was passed, to about 5 percent in 1970.
Immigration picked up substantially after the passing of the Immigration and Nationality Act of 1965 (the Hart-Celler Act). Hart-Celler relaxed, but did not completely abolish, the strict 1920s era national quotas. Country limits were maintained, but the range of countries permitted was expanded, and preferences were given for immigrants with in-demand skills, and, especially, for immigrants with family members already in the United States. Immigration increased overall, and the mix shifted, with a smaller proportion of European and Canadian immigrants and a broader mix overall.
The third landmark legislation was the 1986 Immigration Reform and Control Act (the Simpson-Mazzoli Act). Simpson-Mazzoli tightened up on employers who employed undocumented workers (at least in theory), and increased spending on border security, especially the border with Mexico. Most famously, Simpson-Mazzoli provided a one-time legalization of undocumented immigrants who had resided in the U.S. for at least 4 years and could pass certain other tests and pay back taxes and fines. The latter was widely termed an “amnesty,” in which about 3 million immigrants participated. The program remains politically controversial, although the economic impacts appear to have been modestly positive.
In the event, the 1965 and 1986 acts, and other policy changes, were accompanied by a return to rates of immigration that were closer to the pre-1924 era. Immigrants now represent about 13 percent of the U.S. population. While the overall rates of immigration are not unlike those of a century ago, the mix of immigrants by country of origin is very different.
More to the point to readers of this entry, Dr. Coronado demonstrated the importance of immigration to employment, and economic development in general, especially as the boomers age out and the labor force participation of younger Americans has declined. It doesn’t take much perusal of the data to discover that immigration drives an increase in the American labor force and employment, an important component of our overall economy. Overall growth of the economy, whether national state or local, is of course a combination of growth in our labor force, and its productivity. Less obvious, but well documented by research that Julia reviewed, is that immigration also has a positive effect on productivity, through channels related to increased investment, improved research and development, and innovation and entrepreneurial “animal spirits.”
Much of our recent national discussion on immigration focuses on unauthorized immigration. Most immigration is, in fact, legal and authorized. Much of the national discussion focuses on Mexico and to a lesser extent Central America. Of course a large portion of immigrants of both types are from these regions although in recent years Mexican immigration has been declining as a fraction of the share while Asian immigration has increased. Dr. Coronado also pointed out that total unauthorized immigration has declined substantially over the past decade.
In this blog we’ll build on that previous work. We’ll examine a few details, including basic terminology and taxonomies of immigration; and the effects immigration has on U.S. cities, including additional results on labor markets, and some new topics, including the effects immigration has on housing markets, on local public finance, and on some of the public services cities provide.
Basic Terminology
Immigrants are foreign-born individuals who were not U.S. citizens at birth. That much will be obvious to the most casual observer. Slightly less well known is the fact that those born in Puerto Rico and U.S. territories are U.S. citizens. After several recent election campaigns, it’s now well known that individuals born outside the U.S. to one or more US parents are citizens. Famous examples include George Romney (Mexico), John McCain (Panama) Ted Cruz (Canada) and two of my grandchildren (South Korea).
Lawful immigrants include: naturalized citizens; lawful permanent residents, i.e. green card holders; individuals granted asylum, e.g. if fleeing religious or political persecution; individuals admitted with refugee status; and individuals granted temporary status for long-term residents and work such as H-1B or L-1 visa holders.
Other categories of immigration status include visitors on short term tourist or transit visas, i.e. not residents. Immigrants may also be granted Temporary Protected Status, often after natural disasters; for example those admitted on a temporary basis after Haiti’s earthquake. Another category much in the news comprises individuals who arrived unauthorized as young children: Deferred Action for Childhood Arrivals (DACA, also known as the “Dreamers”). And finally, there are unauthorized immigrants, a.k.a. undocumented immigrants, or illegal immigrants: those who came into the U.S. illegally, or who came in legally but overstayed their visa.
Pew Research estimates the number of immigrants in each of the major categories. Of the 43.6 million foreign born residents Pew estimates lived in the U.S. in 2014, 19.0 (44 percent) are naturalized citizens; 11.7 million (27 percent) are lawful permanent residents; 1.7 million (4 percent) are temporary lawful residents; and 11.1 million (26 percent) are unauthorized immigrants.
More Basic Data
Julia Coronado’s blog entry demonstrated the recent slowdown in immigration generally, and the reversal of unauthorized immigration. Here we’ll extend her national numbers with a little statewise data.

Exhibit 1 shows that foreign-born residents comprise above average shares of the tri-state population. New Jersey and New York are especially rich in immigrants, with well over a fifth of the population of those two states born outside the United States.
How do we count the unauthorized immigrant population? The most detailed and up-to-date estimates come from Pew Research Center. Their data in turn begin with sources from the Census Bureau and the Department of Homeland Security. The details are complex, but the basic idea is to count the overall foreign-born population using general purpose surveys such as the decennial Census or the American Community Survey. Then we estimate the legal population from immigration records collected by the Department of Homeland security and other data sources. We obtain unauthorized immigrant counts by subtraction. See Pew Research for additional details.

Exhibit 2 shows that unauthorized immigration is a small part of total immigration; although New York and New Jersey’s fraction of population from unauthorized immigration is a bit higher than the national averages. The national unauthorized immigrant population fell between 2009 and 2014, the latest year of reliable data. Most of this decline was in California, Nevada, Kansas, Illinois, Alabama, Georgia and South Carolina. The unauthorized immigrant population estimates increased in Washington, Louisiana, Virginia, Pennsylvania, New Jersey and Massachusetts. Connecticut and New York were among the states that were about the same.
Overall, U.S. immigration began to slow down circa 2011. Recent years have seen a slowdown in unauthorized Mexican immigration, starting in 2009, although it was slightly offset by a very slowly rising number of unauthorized immigrants from other countries.

Exhibit 3 shows that New Jersey’s migrant or foreign-born population is not dominated by Mexicans as we see in places like the Southwest in California. The tri-state area is overweight Europeans and Canadians, immigrants from the Caribbean and South America.
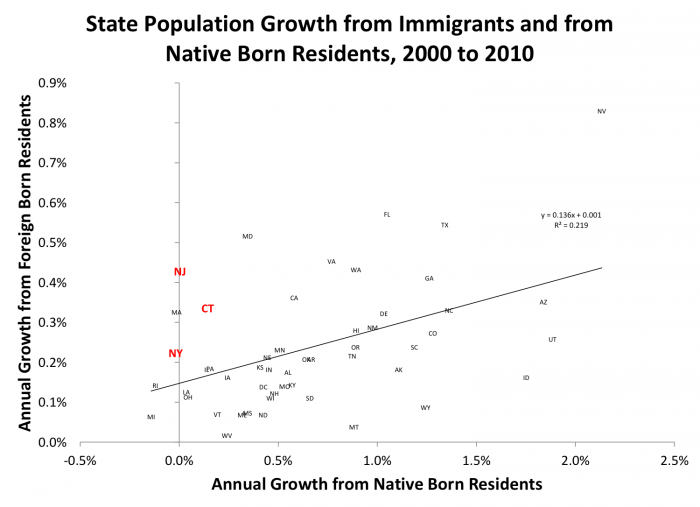
Exhibit 4 decomposes annual population growth from 2000 to 2010 in the 50 states plus the District of Columbia into the growth from foreign born residents, on the vertical axis, and native born Americans, on the horizontal axis. These two categories are just a little different from measuring national immigrant and non-immigrant shares, because once an immigrant lives inside the U.S. she can be counted in further state-wise changes in the foreign born population when if she moves from one state to another.
The Exhibit shows there’s a modest correlation between these two sources of state population growth. Nevada, in the upper right corner of the chart, experienced by far the fastest growth of native born population and foreign born residents. More to our purposes, the chart shows that New Jersey, New York and Connecticut each experienced almost no growth from native born residents; our growth came almost entirely from foreign born residents.
Immigration and Urban Labor Markets
Julia pointed out the long term decline in America’s working age population, from which most of the labor force is drawn. She made the point that immigration is, directly and indirectly, becoming even more the driving force in labor market expansion. Exhibit 4, above, reinforces that this is even more true in our region than in the country as a whole.
How prepared are these new residents for the American labor market? Immigrants are somewhat more likely to be very highly educated than the U.S. population and at the same time immigrants are much more likely to be low skilled. How so? It’s because immigrants are less likely to come into the middle distribution of skills and education.

Exhibit 5 presents some basic data on immigrant human capital from Pew Research. Despite the prevalence of some very high skilled immigrants, immigrants are less skilled on average than the native-born population. Increases in immigration can therefore increase the proportion of low-skilled labor in a city’s labor force.
David Card has shown that these effects can lower the measured wages of low-skilled native-born workers relative to the native-born with somewhat higher skills; this differential between low-skill and middle-skill natives can be as much is 3 to 5 percent larger in the highest immigration cities compared to those with low rates of immigration.
At the same time, overall, the productivity effects and other positive contributions of immigration documented in Julia’s previous blogs shifts the entire wage distribution of high-immigration cities upward. With these higher dollar returns to labor, this upward shift can reduce eliminate the negative distributional effects of higher immigration. (Card does not break out New Jersey in his analysis, but he does include the New York and Philadelphia CBSAs which contain respectively about 73 percent, and 15 percent, of New Jersey’s total population.)
Another way to compare immigrants’ skill and education levels is to compare immigrants to their country of origin. Most studies have shown positive selection; Pew Research data shows this. But Mexican immigrants are somewhat negatively selected.
Immigration and Urban Housing Markets
Many studies confirm that immigrants positively affect demand for housing, especially rental housing as research by Louise Keely and the Demand Institute have documented.
More detailed econometric modeling by Saiz and by Greulich Quigley and Raphael show that rents increase with higher rates of immigration. But as we’ve already posited, overall incomes also rise. Thus typical rent-to-income ratios (housing budget shares) are thus largely unchanged.
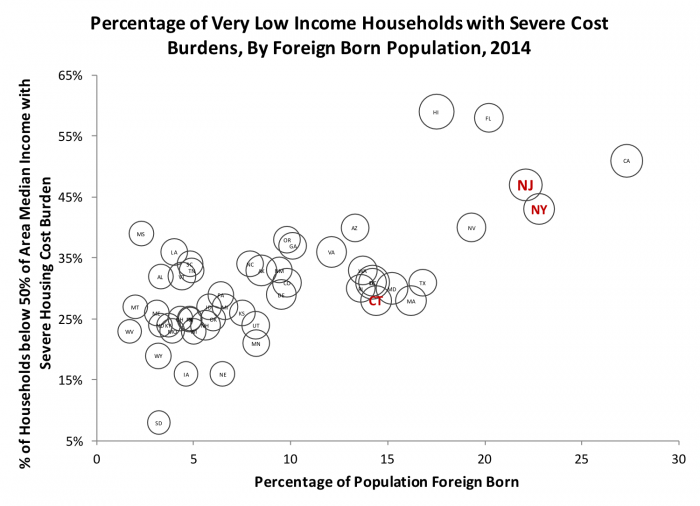
But our labor market discussion above suggests that adverse housing effects from immigration are more likely felt at the bottom of the market. Exhibit 6 is a modification of one of our charts from the housing affordability review in an earlier post, showing the percentage of households below 50 percent of area median income with severe housing cost burdens, i.e. spending more than half their income on rent and basic utilities. The plot is suggestive; low income households in states with a high degree of foreign born residents tend to spend more of their income on housing. New York and New Jersey are very much high-immigration, high-housing cost states.
There is a lot more to study here in future research. The effect of increased immigration, like any demand shift, such as the size and duration of a price increase of any depends on the supply elasticity, that is, the responsiveness of the housing market; and this depends in no small part on taxes, regulations, and other government regulations. We discussed this issue briefly in the affordability blog entry a few weeks ago and will elaborate on this further in future posts.
Immigration and Urban Public Finance
How do immigrants affect our fiscal affairs? Some of the best research on this is by David Card. Card first measures direct effects on cash flows; he shows that immigrants pay on average about $100 per capita less in state and federal income taxes and Social Security payments than the native born; but they also receive about $600 less, on average, in cash transfers from programs like Social Security.
But as Card points out, this static analysis is very incomplete. To incorporate the effects of other state and local taxes such as sales taxes and property taxes, local expenditures on schools and other services, and also to take a longer run approach, Card undertakes some simple econometric analyses. He finds that increased local revenue and spending on local public services attributable to immigrants roughly cancel; that is, Card finds no net local fiscal burden once a broad set of costs and benefits are considered.
Immigration and Local Public Services
Immigrants tend to increase demand for local public services, particularly education, partly because of immigrant children, but also because of the aforementioned higher fertility of first and second generation immigrants. Peer effects have long been shown to be important determinants of school quality (Epple and Romano). Card argues that because immigrants (on average) tend to have lower incomes and education than native borne Americans, and parental income and education are among the predictors of student test scores (Card and Rothstein), immigrant children will be viewed as less desirable peers. Thus, Card argues, schools with large numbers of immigrants will be perceived as inferior; and this in turn can have adverse consequences for housing prices as well (Figlio and Lucas).
The Political Economy of Urban Immigration
Any economic change, whether a government policy or a private market activity, produces winners and losers. Economists define a situation as “Pareto optimal” on those very rare occasions when all participants win, with absolutely no losers. But if we dig deep enough, it’s very difficult to find real-world examples of pure Pareto optimality. Real estate is a good example. Even the best designed and sited project imposes some costs on some individuals or enterprises. Anyone who thinks otherwise has never been to a local planning meeting.
Trade, whether between nations, cities, or individuals, is another generally win-win activity; but dig deep enough and you’ll find that the costs of growth in trade are born by some people and the benefits borne by others (Autor et al.) In the aggregate international and regional within-country trade is been shown over and over again to provide significantly more benefits in the aggregate than the costs imposed on the losers. Thus increasing trade is efficient. By neglecting the costs borne by some who lose through adjustment costs, we neglect some of our fellow citizens and can generate opposition that limits our ability to increase the efficiency of our economy by growing our trade.
The same holds true for immigration. Study after study has shown that overall immigration is a win-win for the U.S. economy, but as documented in several papers by George Borjas, among others, there are some individuals whose employment prospects are dimmed and whose wages are lowered. Unless we identify and consider ways to mitigate the costs borne by these people, we can expect continued pushback and lost opportunities for gains from immigration.
Our citizens view immigration not just through calculated economic costs and benefits. Emotions are involved as well. Emotions are often associated with risk, but also with fear of “the other,” those we perceive to be unlike ourselves, to be unfamiliar. In Daniel Kahneman’s famous typology, humans think in two different ways. Type I thinking is intuitive and emotional; Type II is rational and calculating. We need both in order to survive. Type I generally kicks in on issues related to security, whether physical or economic; it’s no easy feat to get Type II working in such circumstances.
The Bottom Line
Immigration has been a hot topic in the United States for years, although the 2016 election and the early actions of the Trump administration have brought the topic even more to the fore. Immigration turns out to be like a lot of other economic phenomenon: not as well understood as we might like, frequently discussed by media and politicians in the absence of basic facts, and often more prone to emotional response than rational analysis.
Overall the benefits of immigration, like the benefits of foreign trade, are positive and robust. Also like trade, there are often some losers as well as many winners. We can do a better job of identifying these losers and perhaps mitigating some of the cost that they bear. In particular low-income New Jerseyites and other similarly positioned Americans have seen disappointing economic outcomes over the last several decades. Judicious immigration policies can contribute to local economic development, and if well designed can also be progressive in the sense of broadening the base of beneficiaries from that growth. We will analyze other positive business and public policies – in investment, education, infrastructure, taxation and regulation – in future posts.
References and Further Reading
Abramitzky, Ran, Leah Platt Boustan, and Katherine Eriksson. “A Nation of Immigrants: Assimilation and Economic Outcomes in the Age of Mass Migration.” Journal of Political Economy 122, no. 3 (2014): 467-506.
Aghion, Philippe, Leah Boustan, Caroline Hoxby, and Jerome Vandenbussche. “The Causal Impact of Education on Economic Growth: Evidence from Us.” Unpublished paper, (2009).
Autor, David H, David Dorn, and Gordon H Hanson. “The China Shock: Learning from Labor-Market Adjustment to Large Changes in Trade.” Annual Review of Economics 8, (2016): 205-240.
Ayala, Francisco José, Francisco J Ayala, and Camilo J Cela-Conde. Processes in Human Evolution: The Journey from Early Hominins to Neandertals and Modern Humans: Oxford University Press, 2017.
Borjas, George J. “The Economics of Immigration.” Journal of Economic Literature 32, no. 4 (1994): 1667-1717.
Borjas, George J. Immigration Economics: Harvard University Press, 2014.
________. “Immigration and Globalization: A Review Essay.” Journal of Economic Literature 53, no. 4 (2015): 961-974.
Borjas, George J, and Joan Monras. The Labor Market Consequences of Refugee Supply Shocks. National Bureau of Economic Research, 2016.
Bowen, Harry P, and Jennifer Pédussel Wu. “Immigrant Specificity and the Relationship between Trade and Immigration: Theory and Evidence.” Southern Economic Journal 80, no. 2 (2013): 366-384.
Card, David. “How Immigration Affects U.S. Cities.” In Making Cities Work: Prospects and Policies for Urban America, edited by Robert P Inman, 158: Princeton University Press, 2009.
Card, David, and Giovanni Peri. “Immigration Economics by George J. Borjas: A Review Essay.” Journal of Economic Literature 54, no. 4 (2016): 1333-1349.
Ellen, Ingrid Gould, Katherine O’Regan, Amy Ellen Schwartz, Leanna Stiefel, Derek Neal, and Thomas Nechyba. “Immigrant Children and New York City Schools: Segregation and Its Consequences [with Comments].” Brookings-Wharton Papers on Urban Affairs, (2002): 183-214.
Epple, Dennis, and Richard Romano. “Peer Effects in Education: A Survey of the Theory and Evidence.” Handbook of social economics 1, no. 11 (2011): 1053-1163.
Figlio, David N, and Maurice E Lucas. “What’s in a Grade? School Report Cards and the Housing Market.” The American Economic Review 94, no. 3 (2004): 591-604.
Hainmueller, Jens, and Daniel J Hopkins. “Public Attitudes toward Immigration.” Annual Review of Political Science 17, (2014): 225-249.
Harari, Yuval Noah. Sapiens: A Brief History of Humankind: Random House, 2014.
Hoefer, M., N. Rytina, and B.C. Baker. “Estimates of the Unauthorized Immigrant Population Residing in the United States: January 2010.” Washington: Department of Homeland Security, (2011).
Jonsson, S.H., and M.S. Rendall. “The Fertility Contribution of Mexican Immigration to the United States.” Demography 41, no. 1 (2004): 129-150.
Kahneman, Daniel. Thinking, Fast and Slow: Farrar, Straus and Giroux, 2011.
Kennedy, John F. A Nation of Immigrants: Harper Perennial, 2008.
Massey, Douglas S, and Chiara Capoferro. “The Geographic Diversification of American Immigration.” New faces in new places: The changing geography of American immigration, (2008): 25-50.
Massey, Douglas S, and Karen A Pren. “Unintended Consequences of Us Immigration Policy: Explaining the Post‐1965 Surge from Latin America.” Population and Development Review 38, no. 1 (2012): 1-29.
Ottaviano, Gianmarco IP, and Giovanni Peri. “The Economic Value of Cultural Diversity: Evidence from Us Cities.” Journal of Economic Geography 6, no. 1 (2006): 9-44.
Painter, Gary, and Zhu Yu. “Immigrants and Housing Markets in Mid-Size Metropolitan Areas.” International Migration Review 44, no. 2 (2010): 442-476.
Putnam, Robert D. “E Pluribus Unum: Diversity and Community in the Twenty‐First Century the 2006 Johan Skytte Prize Lecture.” Scandinavian political studies 30, no. 2 (2007): 137-174.
Saiz, Albert. “The Impact of Immigration on American Cities: An Introduction to the Issues.” Business Review Q 4, (2003): 14-23.
________. “Room in the Kitchen for the Melting Pot: Immigration and Rental Prices.” Review of Economics and Statistics 85, no. 3 (2003): 502-521.
________. “Immigration and Housing Rents in American Cities.” Journal of Urban Economics 61, no. 2 (2007): 345-371.
Schwartz, Amy Ellen, and Leanna Stiefel. “Immigrants and Inequality in Public Schools.” Whither opportunity, (2011): 419-442.
Wilson, Jill, and Audrey Singer. Immigrants in 2010 Metropolitan America: A Decade of Change: Metropolitan Policy Program, Brookings Institution, 2011.