Yes, but it’s unlikely to be the primary catalyst for a recession.
Housing is one of the most cyclical sectors in the economy. It has become a drag on GDP growth an average of three calendar quarters ahead of post-war recessions and tends to subtract more than a percentage point off growth at the peak of a downturn. Housing has currently been a drag on GDP growth for the past six quarters ending Q2 2019. Drilling into the drivers of housing demand, it appears consumers have become more cautious on housing despite a return to very low mortgage rates this year and continued optimism about their own economic prospects. This could reflect a view that prices have risen too much or that the broader economy is vulnerable to a downturn even if they expect to retain their own job. In addition, foreign demand for US housing has plummeted this year, accounting for a third of the overall decline in existing home sales. Sales to buyers from most major countries has declined with sales to buyers from China and Mexico down more than 50%, potentially reflecting weakness in the global economy as well as an increasingly unwelcome environment in the US. Weakness in housing represents a vulnerability but is unlikely to be the primary catalyst pushing the economy into recession as US households are not highly leveraged to home prices as they were in the housing boom. Households also remain optimistic about their own financial prospects, suggesting the weakness is in housing is not in imminent danger of spreading to other types of spending.
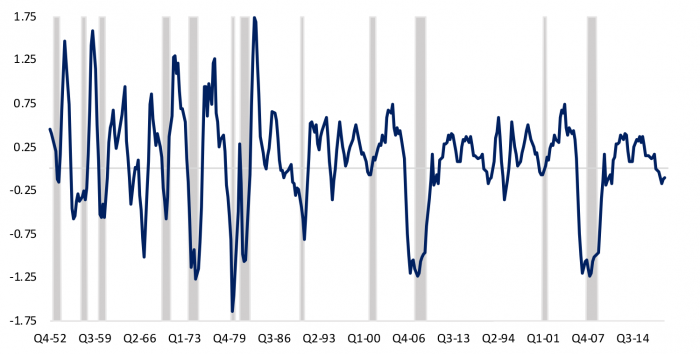
Housing demand is flashing a warning signal for the current expansion
Housing is one of the most cyclically sensitive sectors as it is responsive to both confidence and interest rate channels. When interest rates rise at the peak of a cycle, housing demand tends to soften. Also when fear and uncertainty about the future rise, people are less likely to make large purchases that often entail borrowing and funding with future income. Figure 1 illustrates that housing demand as measured by the average contribution of residential investment to GDP growth over four quarters has begun to decline on average 3 quarters ahead of a recession in the post-war period. By this measure housing has been a drag on GDP for the past six quarters, albeit a relatively small one subtracting 0.11 percentage points or 11 basis points off GDP over the four quarters ending in Q2 2019. While the overall economy continues to perform reasonably well, fueled by consumer spending on other goods and services, there is concern that weakness in housing is a signal of vulnerability. The answer seems to be that it may very well be, but perhaps for different reasons than in the past.
Figure 1: Contribution of Residential Investment to GDP Growth (percentage points, 4-qtr avg)
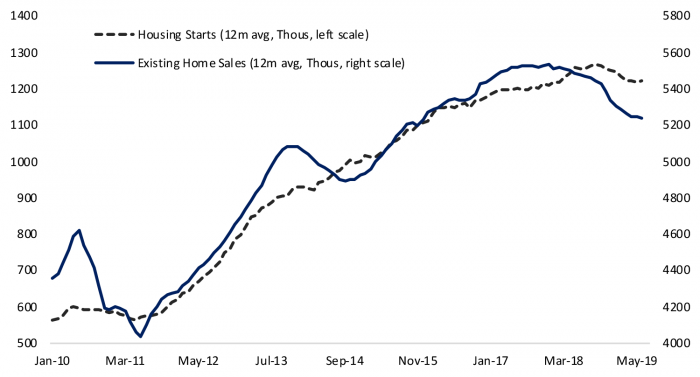
The three components of residential investment in GDP are the construction of new homes and condominiums (either for sale or rent), renovations to existing homes, and broker commissions from home sales. Construction of new homes is roughly half of residential investment in recent years while renovations and broker commissions on home sales account for 30% and 20%, respectively. All components of housing demand have declined over the past year. Figure 2 shows that construction of new homes has declined about 2-1/2% in the year ending in June 2019, while existing home sales have fallen off more sharply with a 4-1/2% decline. Spending on improvements (not shown) has also dropped off 8.8%.
Figure 2: Home Construction and Sales Have Declined Over the Past Year
Exploring the drivers of weaker housing demand
The decline in housing demand that first became evident in 2018 in existing home sales can likely be at least partly attributed to a jump in mortgage rates from around 4% at the beginning of last year to a peak close to 5% in Q3 2018. While 5% is still a low rate by historical standards, the 1% increased implied a 12% jump in the home payment on a median priced home. Mortgage rates have since more than retraced the 2018 spike and have fallen notably below 4% in recent months, yet housing demand has continued to decline, suggesting a possible rise in consumer concern over future income prospects or an expectation that home prices may decline if the economy weakens, providing a better opportunity for buying later.
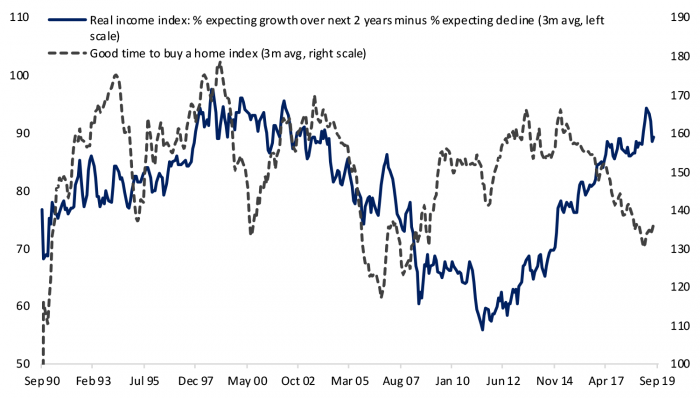
Detailed results from the University of Michigan Survey of Consumers can shed light on the drivers of weaker housing demand. Figure 3 shows that the net percent of respondents expecting their household income to outpace inflation over the next two years has risen steadily and remains at healthy levels, consistent with the ongoing strength we see in labor market indicators. Meanwhile the share of respondents saying it is a good time to buy a home has been declining in recent years after rebounding earlier than income expectations early in the expansion. Consumer assessments likely reflect a combination of expected future home price appreciation, financing conditions and personal finances. However the expected real income index, as well as other detailed questions on personal finances in the Michigan survey, reflect continued optimism on financial well-being. And although mortgage rates have declined, the assessment that it is not as good a time to buy a home likely embeds some degree of expectation that prices are likely to drop.
Figure 3: University of Michigan Survey of Consumers Shows Consumers Upbeat on Income, Downbeat on Housing
There are a number of motivations to buy property in addition to homes purchased by consumers as their primary residence. Since 2012 the National Association of Realtors has conducted surveys on the types of buyers purchasing existing homes and it reveals the shifting forces at play in the recovery from the housing bust. In Figure 4 investors are buyers who are partnerships or corporations rather than individuals. There is overlap between investors and all cash buyers as investors are more likely to buy in cash. There is overlap between first-time buyers and cash purchases as well, although first-time buyers are much more likely to finance their purchase with a mortgage. Other includes existing homeowners financing their purchase.
Figure 4: Housing Demand Has Slowed Across Different Types of Buyers
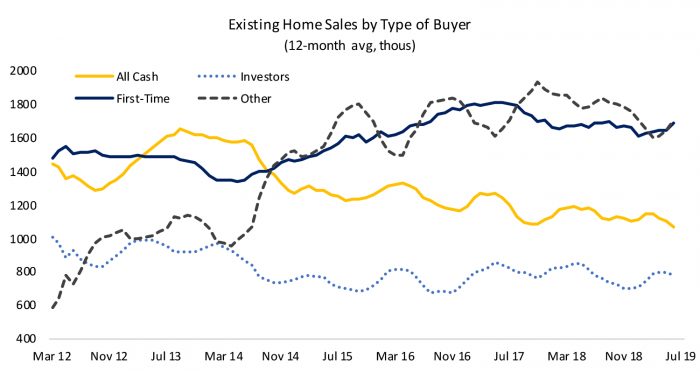
Figure 4 reveals that earlier in the housing recovery a third of buyers paid in cash. Home sales in 2012 were down 35% from their peak pace in 2005 and mortgage credit was still impaired, so overall housing demand was weak, and many buyers paid in cash. As mortgage markets recovered, the share of cash buyers has declined to 20% over the past year and a low of 16% in June, possibly reflecting a response to new lows in mortgage rates. The share of investors has been steadier, although sales have drifted lower as home values recovered, and the share of purchases averaged 14% over the past year versus 20% in 2012. There has been a slight drift lower in demand from first-time and existing homebuyers in recent years as well despite low interest rates, although the latest drop in mortgage rates is relatively recent and may take some time to be reflected in sales data.
The decline in sales has been more pronounced among existing homeowners buying with financing and cash buyers. One driver has been a sharp drop in purchases by international buyers. International buyers include non-residents as well as visa holders, students and recent immigrants. A recent study by the National Association of Realtors showed that international buyers are more likely to buy in cash (40%), more likely to buy condominiums versus single-family dwellings (24% of international buyers versus 11% of total existing home sales), and only half of all purchases served as a primary residence. International buyers represented 5% of existing home sales in 2018, down from a peak of 7.5% in 2010, and their purchases plummeted 31% in 2019 accounting for a third of the total drop in sales.
Figure 5: International Demand for US Housing Has Fallen Sharply
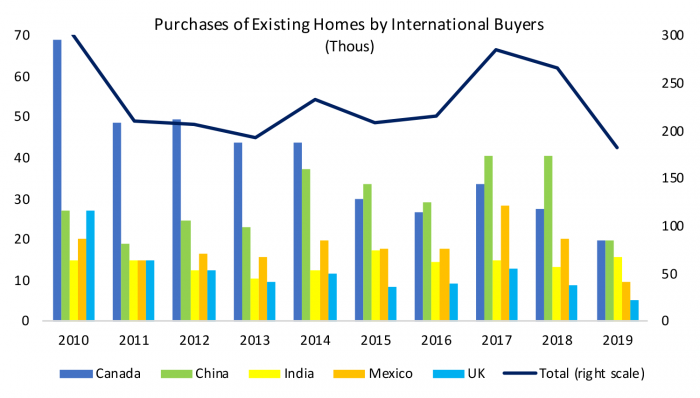
Figure 5 shows that Canadians used to be the largest buyers of US homes although both their share and number of purchases has declined in recent years as purchases by buyers from China and Mexico have risen. Florida remains the number one destination of all foreign purchases followed by California and Texas. Sales dropped for all major foreign buyers in 2019, with the exception of sales to buyers from India, with sales by Chinese and Mexican buyers off more than 50%. The decline in sales may reflect weakness in their own economies as well as a rise in nationalism in the US that may make it a less appealing destination for a second home. The NAR notes some buyers purchase for their children studying in the US, although international student enrollment was only down 3% in 2019, suggesting it is likely not the primary driver of the decline in demand.
The presence of a significant share of cash buyers, investors and foreign buyers means mortgage rates are not a primary driver of demand for many buyers at the margin. Weakness in housing demand can also be self-perpetuating as buyers of all types react by moving to the sidelines in anticipation of better buying opportunities down the road. Weakness in housing represents a vulnerability but is unlikely to be the primary catalyst pushing the economy into recession as US households are not highly leveraged to home prices as they were in the housing boom.