… But surprisingly, this time the US consumer was not responsible.
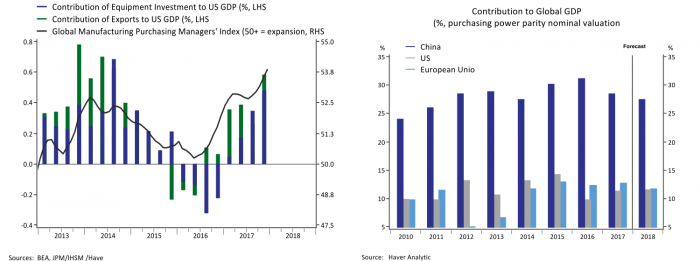
The recent GDP report for Q4 2017 confirmed a solid growth performance that was an improvement on 2016 and in line with some of the better years of the current recovery and expansion. Perhaps surprisingly, the US consumer was not responsible for the pick up in growth. Rather stronger exports and investment in energy and other externally facing sectors drove both the slowing in 2016 and pick up in 2017. The conventional view of the US as a largely closed economy and the US consumer as the driver of global demand no longer applies. China has become the more dominant driver of growth in global demand and the US economy is increasingly sensitive to global developments. With broad-based global momentum, the US is also getting the year off to a good start. However, we need to be watching developments in China and the global economy more generally as we evaluate prospects for the US.
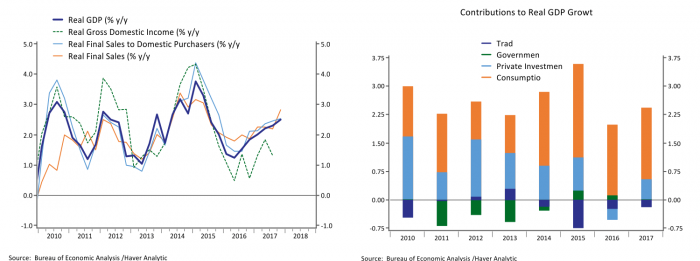
The numbers are in: GDP growth rose a solid 2.5% Q4/Q4 in 2017, a step up from 1.8% in 2016. The left-hand chart of Figure 1 shows the different measures of GDP. While gross domestic product measures the increase in output from various sectors, gross domestic income measures the income produced by this activity and is sometimes thought to be measured with greater accuracy in real time. Growth in real final sales subtracts inventories from GDP as they can be volatile, while real final sales to domestic purchasers also strip out exports to get a gauge of purely domestic activity. All measures are basically telling the same story: growth has picked up after having slowed in 2015 and 2016. The 2017 performance is on par with that registered in 2010, 2012 and 2013 but falls a little short of the cycle’s peak growth in 2014 and early 2015. Even as the first estimate of GDP growth for Q4 fell a bit short of expectations, the year ended on a solid note with good momentum going into 2018.
Much has been made of the fact that GDP growth has averaged only around 2% during this recovery (the average now stands at 2.2% since Q3 2009). However, both the Federal Reserve and the Congressional Budget Office estimate that long-run potential growth in the US – the pace at which the economy would neither overheat nor cool down and the unemployment rate would hold about steady – currently stands at around 1.8%. The fact that the US economy has been growing above trend since 2009 is confirmed by the fact that the unemployment rate has been declining an average 0.7 percentage points per year from the peak of 10% in October 2009 to 4.1% at the end of 2017. Lower potential growth as compared to prior decades is primarily a function of slower population growth, and population growth is poised to slow further with the birth rate stuck at all-time lows and policies aimed at curbing immigration.
While the economy has grown above trend for the past 8½ years, the pace has been uneven. The left side of Figure 1 shows a slowing in 2011 as the US economy absorbed the self-inflicted wound of a near default and debt downgrade, as well as the first round of the European debt crisis. The resilient and diversified US economy staged a rebound early in 2012 only to be interrupted by the second wave of the European debt crisis. The US really gained steam in 2013 and 2014 only to have a global slowdown led by China wash upon our shores. The experience of the current recovery and expansion highlights that the US is no longer a largely closed economy immune from what is happening abroad, a topic I will return to later.
US Consumers are Not Driving this Train
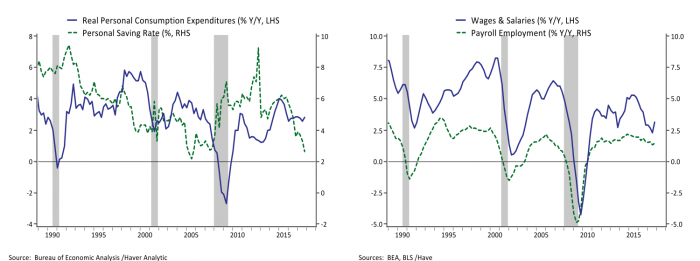
The contributions to GDP growth by sector are shown in the right panel of Figure 1. The pick up from 2018 to 2017 was driven by a rebound in investment, as well as a smaller drag from trade. Growth in consumer spending has been steady and the government sector has been largely neutral after years of contraction earlier in the recovery on sequestration budget cuts, as well as belt tightening and cutbacks at the state and local level. The left panel of Figure 2 shows the annual growth rate of consumer spending, which has been remarkably steady in recent years, plotted against the personal saving rate. It may seem surprising that the US economy picked up last year without any assistance from an acceleration in consumer spending, particularly when measures of consumer sentiment have been reaching cycle highs.
The decline in the personal savings rate helps square the circle. The right panel of Figure 2 illustrates that growth in both hiring and wages and salaries has moderated somewhat over the past two years. Hiring continues at a solid pace but, as the economy gets closer to full employment, job growth typically moderates as there are fewer workers to hire. Consumption growth might have slowed in 2018 in line with the moderation in wage growth, which would have left the saving rate steady. Instead a booming stock market and a strong labor market helped increase consumer confidence and households decided to dip into their savings to maintain their spending momentum, something economists refer to as a wealth effect.
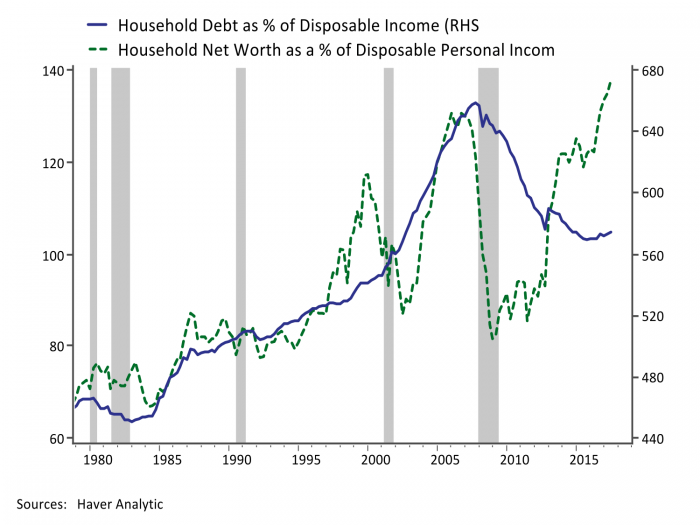
Even as consumers spend a little more in response to record high balance sheets, they seem to have changed their behavior since the housing bubble. Figure 3 plots household net worth as a percent of disposable income against the ratio of debt to income. Household net worth continues to notch new highs, driven primarily by a relentless stock market rally; however, consumers are not taking on increased debt in response. Debt as a percent of income has moved a little higher on increased mortgage borrowing, but only marginally. Moderate debt growth could reflect greater prudence on the part of consumers, credit standards that haven’t loosened to the same extent as in the late 2000s, an aging population less inclined to borrow, or most likely a combination of these factors.
The personal saving rate has dipped a bit more in the past year than during the stock market boom of the late 1990s (although it is worth noting the data get revised over time; some of the initial estimates of the saving rate in the late 1990s were much lower than current figures), but consumption hasn’t seen the same late cycle surge reflecting the fact that wage growth has failed to pick up in response to a tight labor market in the same way as the last two cycles. The main questions for the US consumer in 2018 seem to be the following:
- Will we see faster wage growth given the continued tightening in the labor market?
- Will consumers start to take on more debt in response to rising asset valuations?
- Will consumer spending moderate as consumers decide they have reduced their savings enough?
The influence of the wealth effect highlights that the trajectory of consumer spending in 2018 will be influenced by the fate of the stock market rally, although they are less leveraged to this asset boom than to the housing bubble.
Housing Investment Chugging Along, Structures Investment Rebounding
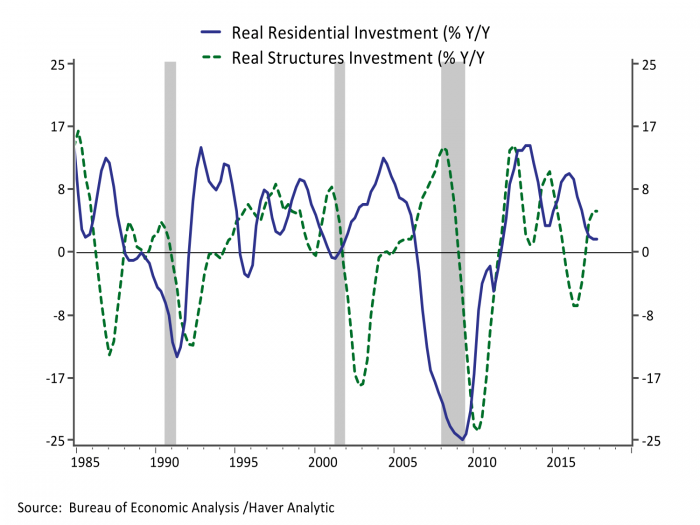
The single-family housing market continued a slow steady pace of expansion in 2017. Home sales and construction activity continued to grow at a high single-digit pace. Home prices nationally exceeded their prior peak reached in 2005, which is both a positive and a negative for the single-family market. With fewer homeowners underwater on their mortgages (Zillow estimates 10.3% of homeowners owe more than their house is worth, down from a peak above 31% in 2011) and total home equity having recovered to its 2005 level, more existing homeowners are able to move and transact. However, first-time homebuyers are faced with high prices, credit standards that have eased somewhat but remain notably tighter than in the housing boom, and now rising mortgage rates limiting upward momentum. Meanwhile, after a multi-year boom the supply of multi-family housing is finally catching up with demand and construction activity declined a bit in 2017, leading growth in overall residential investment to slow to just 1.7% y/y (Figure 4).
Even as residential investment moderated, structures investment rebounded in 2017 after two years of declines (Figure 4). The decline and rebound are more than accounted for by the energy and mining sector and track the swings in commodity prices in recent years. The 2017 rebound in structures spending overall masks a decline in commercial real estate investment outside of energy driven by reduced spending in the manufacturing and power generating sectors and a moderation in growth in office and health care construction.
A New Place in the Global Order
The ebbs and flows in the current US recovery are closely tied to global developments. Earlier in the recovery the two European debt crises washed ashore through volatility in financial markets as well as reduced confidence and a moderation in exports. The China-led slowdown of 2014-2015 also contributed to increased financial market volatility, but had an even larger direct effect on the US economy than the European events through exports and investment. When the global slowdown contributed to a collapse in energy prices in 2014, many forecasters used conventional thinking to surmise that, since the US is a largely closed economy and a net importer of energy, the main impact would be positive through lower energy prices for consumers and businesses. The conventional framework missed how critical the energy sector, and the strength of the global economy more broadly, has been to US investment in equipment and structures.
The left panel of Figure 5 shows the contribution to US GDP from exports and equipment investment plotted against the global purchasing managers’ index (PMI), which measures the strength of global manufacturing activity. The slowing in US growth in 2016 and the rebound in 2017 are entirely attributable to swings in global manufacturing and commodity prices. Forecasters need to update their approach to thinking about the drivers of US and global growth. No longer is the US consumer king (and queen). An aging US consumer sector burned by the financial crisis and more concerned about retirement adequacy has settled into what appears to be a more prudent, stable approach to their finances and spending. The right chart of Figure 5 shows the contributions to global growth from the US, China and the Eurozone; China’s contribution to growth has been more than the combined contribution from the US and the Eurozone in each year during this recovery. This stands in contrast to the expansion in the 2000s (not shown) when the regions made roughly equal contributions.
The larger Chinese contribution to global growth reflects that the Chinese economy is now close to the same size as the US and Eurozone, but has been growing at close to four times the pace. The faster pace of growth has reflected the earlier stage of development of the Chinese economy; however, China is aging demographically at a similar rate to Europe and the US, and recent growth has reflected a large amount of fiscal stimulus and excess credit creation. In other words, China has repeated the pattern of the US and Europe from prior decades and used excess credit creation and stimulus to avoid the unpleasant realities of slower trend growth (a formula we are trying out again with fiscal policy). That means that in 2018, we need to be watching developments in China, and the global economy more generally, to assess prospects for the US. The year has started with broad-based global momentum; however, Chinese policymakers have been trying to reign in excess credit growth and, like US monetary policy makers, is seeking to engineer a soft landing. Assuming both are successful, we can assume another solid performance in 2018 with some moderation in growth as the year progresses.
