
For the new varietal in place-based development, time will tell
Opportunity Zones are the latest in a series of place-based economic development programs. Is this simply “old wine in new bottles?” Or do Opportunity Zones have features that may yield improvements over the spotty performance of previous programs?
On October 29, 2018 the Rutgers Center for Real Estate held a conference on the new Opportunity Zone economic development program. The conference featured an interview of Sen. Cory Booker by Rutgers Real Estate Academic Director Morris Davis, as well as New Jersey Redevelopment Authority Executive Director Leslie Anderson, representing Governor Phil Murphy as well as herself. Ten leading experts from around the state and the nation then took part in a 90-minute panel discussion of the details of the forthcoming program. Details of the conference and the speakers can be found here.
Introduction
What are Opportunity Zones? Where did they come from? Let’s answer the second question first.
In December 2017 a bipartisan team of Senators Cory Booker (D-NJ) and Tim Scott (R-NC), and Representatives Pat Tiberi (R-OH) and Ron Kind (D-WI) succeeded in inserting a new place-based economic development program, “Opportunity Zones” (“OZ”), into the Tax Cut & Jobs Act. More about the Tax Cut & Jobs Act in general can be found here.
Answering the first question is one purpose of the rest of this presentation. See below.
Economic Opportunity Varies a Lot by Location
It’s unlikely any readers need to be convinced of this basic fact. There are stacks and stacks of books, literally thousands of articles, on the subject, from every scholarly discipline and every political vantage point. What do (for example) William Julius Wilson, Charles Murray, Arlie Russell Hochshild, Ta-Nehisi Coates, Enrico Moretti, James Hughes, Robert Putnam, Douglas Massey, David Brooks, Amy Goldstein, Raj Chetty, J.D. Vance, and Matthew Desmond all have in common? Not much, one might first respond. But all point in one way or another to the importance of place when we think about economic and social problems and opportunities.
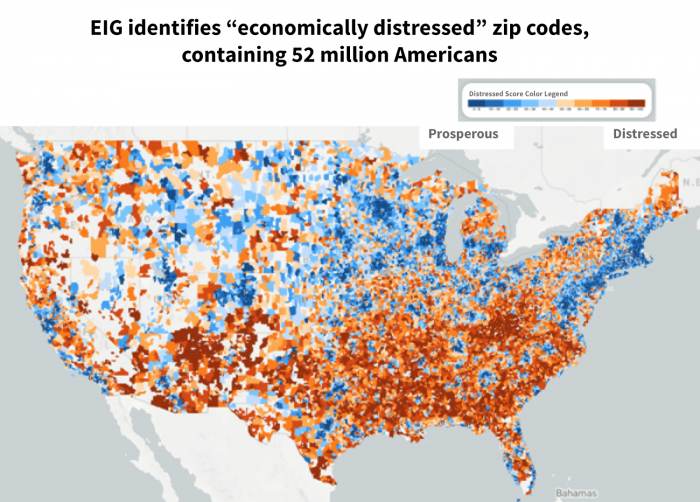
Exhibit 1
Nevertheless, let’s remind ourselves one more time. Exhibit 1 presents a measure that’s been widely cited recently, the Economic Innovation Group’s “Distressed Community Index.” Comprised of ZIP-code level data on seven indicators of education, housing quality, employment, income, poverty and business activity, a national map of the DCI shows a lot of distressed locations around the country, albeit heavily concentrated in Appalachia, parts of the South, and parts of the Great Plains.
Details of the DCI can be found in EIG’s own reports. To give a feel for what it means to move from shades of blue to shades of red, Exhibit 2 presents summary statistics on just one sub-indicator, by EIG’s groupings (quintiles) of “distress” (or lack thereof).
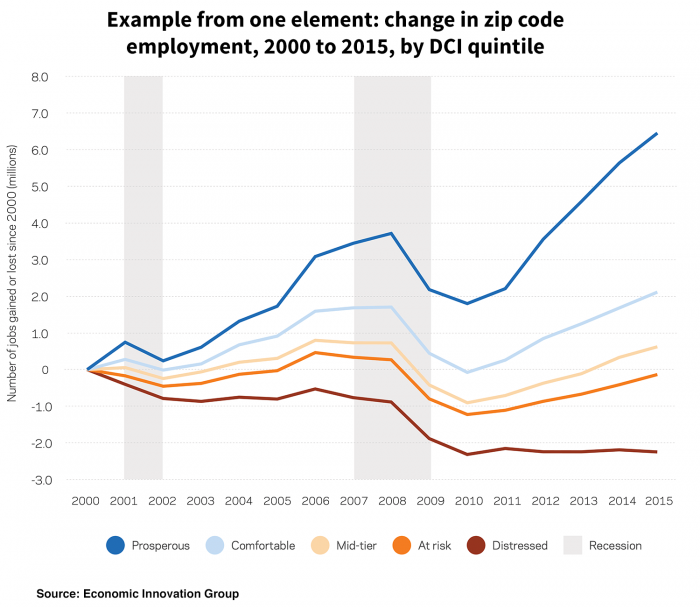
Exhibit 2
Over the entire 15-year period the top quintile of ZIP Codes had total employment growth of about 6.5 million. The next quintile grew by about 2 million; the middle quintile was about half a million. The next-to-bottom quintile declined slightly, and in the bottom quintile employment fell by over 2 million. Furthermore, while every quintile took a hit during the Great Recession, the top quintile bounced back strongly, while the lower quintiles did less well; especially the bottom quintile which basically has flatlined since the end of the Great Recession.
The Distressed Communities Index, like all such indexes or measures, has its shortcomings. In addition to varying the choice of variables, and weightings, we can get a different look with finer-grain Census tract-level data. But pick any measures you want, and map them. Even better, travel through a few large American metropolitan areas (Camden and Newark and Atlantic City will do); or through Appalachia. The initial appeal of place-based strategies becomes obvious when you see the wide variation in prosperity across American locations. Of course, particular place-based strategies – or any other kind of strategy – may or may not be effective in practice, whatever their initial and intuitive appeal.
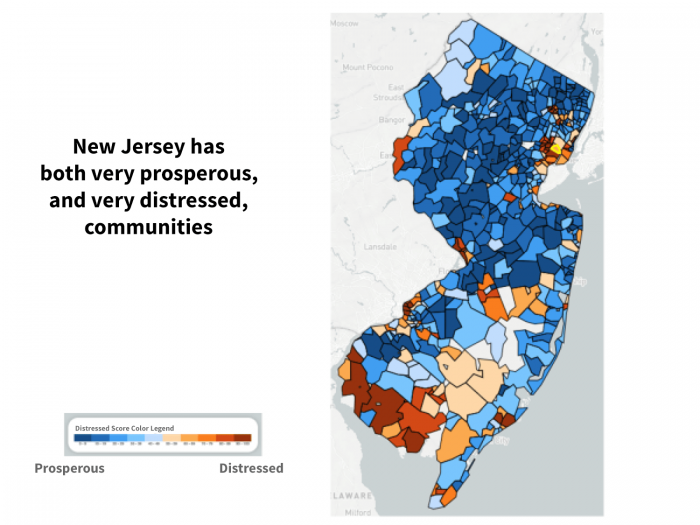
Exhibit 3
The Economic Innovation Group also provides interactive maps by state. Exhibit 3 shows that New Jersey has both very prosperous and very distressed communities, as every resident or student of the state knows. It goes without saying that within a particular ZIP Code or Census tract or any other spatial unit we’ll still find considerable variation. But the variance between the central New Jersey “Wealth Belt” (Hunterdon, Mercer, Middlesex, Monmouth, Morris and Somerset counties), compared to much of southern New Jersey and the areas around Newark and Camden and Atlantic City, are striking. See Hughes and Seneca for elaboration.
Take a few minutes with the state map link above to examine some other states. Compare New Jersey to a state that has very few pockets of prosperity, such as West Virginia. In New Jersey we have our problems, but we also have resources that some other states can only envy.
Examples of Popular Local Economic Development Programs
At some level, it’s hard to think of many government activities – taxes, subsidies, regulations, direct provision of some goods and services – that do not have some effect on economic development, whether that’s their main focus or not.
A menu of popular programs that are often labeled as Local Economic Development (LED) programs would include, for example: tax abatements, industrial bonds, government loans and guarantees, revolving loan funds, historic preservation credits, export promotion assistance, tax increment finance (TIF), incubators, transferable Development Rights (TDRs), eminent domain, and business improvement districts (BIDs). In this note we’ll not say much about those; see White, Bingham and Hill, or Malizia and Feser for discussion of many of these interventions. We will discuss Opportunity Zones (OZs), of course, along with some of their immediate predecessors, namely Enterprise/ Empowerment Zones (EZs), and New Market Tax Credits (NMTC).
Ironically, both research and experience tell us that the most important LED programs are not usually labeled “LED programs.” Obvious examples include education: K12, preschool, technical colleges, universities; infrastructure: roads, airports, freight, water & sewer, flood control, electricity, telecommunications; police and fire, EMS, other safety and security. See Malpezzi (2007) and references therein for discussion.
A Little History of Select Place-based Subsidies
Here we will limit ourselves to selected precursors of Opportunity Zones. In the late 70s, several prominent British policy analysts/makers, Sir Peter Hall, Stuart Butler, and Sir Geoffrey Howe popularized Enterprise Zones (geographically targeted capital subsidies) in the UK. Butler soon championed the idea in the U.S., through the Heritage Foundation, and HUD Secretary Jack Kemp.
Over the next several decades, variations on the localized capital subsidy theme appeared. Sometimes the name hints at the author’s political leanings (enterprise-Republican, empowerment-Democratic and so on). Sometimes the noun rather than the adjective changes, e.g. Renewal Communities and Enterprise Communities. Some were proposed but never implemented, e.g. Promise Zones.
Empowerment Zones combine tax incentives and block grants targeted at low-income Census tracts. Initially six Metropolitan areas were chosen for empowerment zones. These zones are a relatively large. Round 1 Empowerment Zones average about 10 square miles and over 100,000 people.
Early programs like Empowerment Zones often involve many actors, and require many stages of application and review. At the Federal level alone the Department of Housing and Urban Development, US Department of Agriculture (for rural projects), sometimes Health and Human Services, and often the Internal Revenue Service are involved. And of course, state and local governments also get into the act. While Opportunity Zone investments will still be subject to local land use regulations and the like, at least at the Federal level the main thing that’s required is a single form submitted to the Internal Revenue Service.
New Market Tax Credits are the latest place-based subsidy prior to the December 2017 enactment of Opportunity Zones. Like OZs, NMTC subsidize qualified investments in distressed Census tracts. They generate 39% tax credits against federal liabilities, spread over seven years.
Abravenel et al. from the Urban Institute studied early New Market Tax Credit projects. Their best estimate – rough at that – was that about two thirds of projects had timing and/or location favorably modified by NMTC. About one-third of those projects might not have happened at all, according to the survey. New Market Tax Credits are simpler than previous Enterprise Zone and Empowerment Zone programs, but that’s damning them with faint praise. A pair of Government Accountability Office reports explain how these and related programs could be improved with systematic monitoring and evaluation, and simplified design. Opportunity Zones can be viewed as a response to these concerns.
Before we dive deeper into the new Opportunity Zones, how have these older programs performed?
Evidence on Placed-Based Versus People-Based Economic Development Strategies
Over the past several decades there’s been substantial research on Enterprise/Empowerment Zones and the like. What does this work tell us about whether economic development programs should be place-based or people-based? Or about whether our programs, so far, have been effective?
Traditionally, market-oriented economists have been somewhat skeptical of place-based policies that direct investment to specific locations. To summarize the traditional view, economists often begin by asking, “where’s the ‘market failure’ that placed-based programs address?” “If some locations offer better returns than others, let the market sort that out; people can move to the jobs.” Classic papers by Kain and Persky, and Glaeser and Gottlieb, among others, have argued against “gilding the ghetto” in the former’s memorable phrase, in favor of focusing on improving human capital, the demand for labor, and mobility. Policies directed towards people (education, training, a safety net) are usually better targeted to those in need of help.
Of course, a role has always been recognized for infrastructure, schools, local governance, other place-based basic services. On the other hand, studies of agglomeration economies, role of locations in economic success, ranging from Alfred Marshall 150 years ago to an explosion of recent research shows place matters (e.g Chetty; Austin Glaeser and Summers). Other research tells us people are much slower to move than purely pecuniary motives would suggest (Molloy, Smith and Wozniak).
Nevertheless, skepticism remains. Just because places matter, it doesn’t automatically follow that place-based policies we’ve tried work very well. The title of a survey paper by Robert Greenbaum and Jim Landers thus encapsulates the standard view: “Why Are State Policymakers Still Proponents of Enterprise Zones? What Explains Their Action in the Face of a Preponderance of the Research?”
But the programs, and the research, continues. Some recent findings are very much in line with the older consensus. For example, Neumark and Kolko focus on California’s state enterprise zone program. They find no discernible shift in employment towards the lower wage workers targeted by enterprise zones.
But a few high-quality recent studies are more sanguine about these programs. One recent study by Ham et al. examines three programs at once: state Enterprise Zones, federal Empowerment Zones, and federal Enterprise Communities. In contrast to many previous studies, they do find positive and statistically significant improvements in several local employment measures. They also found no evidence of corresponding negative spillovers to adjacent regions; i.e. the improvements to the targeted zones did not appear to come at the expense of nearby locations. Further they found state enterprise programs had weaker affects than the national scale programs. Another recent study, by Busso Gregory and Kline, suggests Empowerment Zones increase employment, and real wages for local workers in the zones.
This recent literature suggests market-oriented economists might be a little more prepared to consider place-based policies. But we’d like to see more rigorous evidence, and careful program design.
Opportunity Zones: Some Details
Here we’ll examine some of the key details of Opportunity Zones (OZs). First, the briefest of overviews. OZs are limited to selected low-income Census tracts. States choose eligible OZ tracts from a larger number that meet basic criteria. Investors in qualified businesses and/or properties in OZs receive subsidies through reduced capital gains taxation. Compared to previous programs (Enterprise Zones, New Market Tax Credits, etc.), there are fewer regulatory hoops; and it’s an entitlement.
Enterprise Community Partners provides a brief definition of three key terms. An Opportunity Zone is a Census tract that’s been designated as eligible to receive private investments through Opportunity Funds. Opportunity Funds are private investment vehicles, certified by the Treasury, that aggregate and deploy capital in Opportunity Zones for eligible uses defined as Opportunity Zone Property. Opportunity Zone Properties are assets eligible for investment under the Opportunity Zones program. While these definitions may appear a little circular at first, we will explain them in more detail below.
The key benefit to investors is derived from a three-part subsidy:
- Deferral of original (pre-OZ investment) gain
- Partial forgiveness of pre-OZ gain, if the investment is held at least 5 years
- Forgiveness of post-OZ investment gain if the investment is held at least 10 years.
States may or may not apply OZ rules to their own capital gains taxes. There are possible complications if original (pre-OZ) investment is in one state, and new investment is in another, but that’s beyond the scope of our discussion today.
Qualified Opportunity Funds are domestic partnerships or corporations that invests only in OZs. OZ assets can be real property, or equity in a business. To reap the benefits of OZs, investors must reinvest from their original asset into a QOF within 180 days of sale.
Assets must be “new” i.e. new or used assets acquired in 2018 or later. Qualified Opportunity Zone Business Property may be “old” assets if they are substantially improved (improvements that at least double the basis of the property). The basis of a property acquired by a QOF will not usually include land value.
A QOF can hold an investment in another QOF. Assets can’t be too much fun, i.e. a liquor store, golf course, country club, massage parlor, hot tub or suntan facility, or casino. There are a number of other tests, penalties etc. that we will not discuss here.
Recent IRS rules appear to give Opportunity Funds some additional flexibility. If the QOF makes investments in a business, what if the business in some way spans more than the OZ? IRS rules require a minimum of 70 percent of the business’s tangible property be in the OZ, i.e. up to 30 percent could be held elsewhere. Also, the rules that require investors in existing property to spend at least as much on improvements as on acquisition applies only to structure cost, not to land costs, which is a help to real estate investors planning to improve existing properties.
One rule embedded in the legislation that may cause some problems for real estate practitioners requires that 90% of the QOF needs to be invested in the OZ within six months from the creation of the QOF. IRS rules have softened this, defining a “working capital safe harbor” given QOFs 31 months to actually deploy capital as long as a clear business plan is devised within the original period, and followed. Nevertheless, anyone familiar with the timeline of real-world real estate developments will recognize that this puts a new cast on the term “shovel-ready project.” For complex commercial projects, especially in cities with stringent development regulations, the shovels will need to be in the ground or nearly so, there won’t be time to form a fund and then start to ponder alternative uses for a site. Our industry has lived with tighter timelines for 1031 exchanges, but this could be a problem for a new program just ramping up.
Which tracts are potentially eligible for designation as an OZ? If a tract is “low-income” by one or more of these measures (using American Community Survey data):
- Poverty rate is 20 percent or higher.
- Median family income (MFI) is below a cutoff:
- 80% of statewide or metropolitan MFI (whichever is lower).
- 85% of statewide MFI, if it’s a rural, “high migration” county (county that’s lost 10 percent or more of its population from out-migration over past 20 years).
A limited number of tracts contiguous to one or more tracts meeting the low-income criteria above and with either a median family income below 125% of the lowest contiguous low-income tract, or a tract containing less than 2,000 people formerly in an Empowerment Zone, may be deemed eligible.
As we’ve already noted, not all tracts that potentially qualify will qualify. Each state or territory can designate up to 25 percent of their low-income tracts (see above) as Opportunity Zones. The actual zones for each state were chosen by governors. Exhibit 4 presents a map of New Jersey’s Zones.
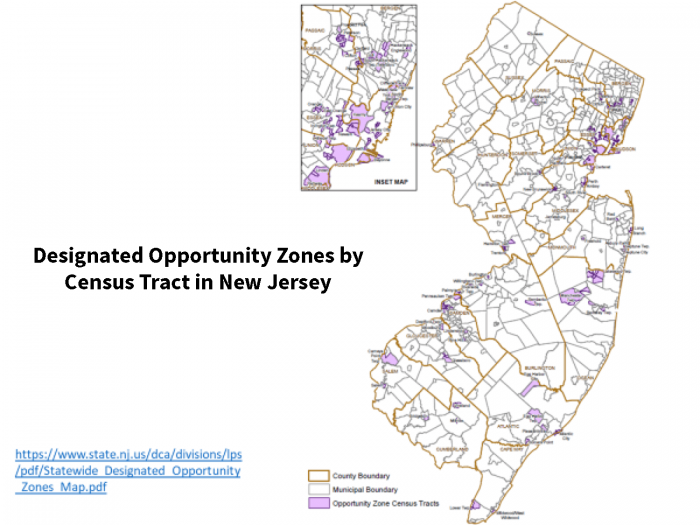
Exhibit 4
Zandari and Reichart note that New Jersey’s governor Phil Murphy chose many zones that met basic low-income criteria, as they must, but also had natural advantages like proximity to transit hubs, universities, airports and the like, that could contribute to successful investments. A list of current qualified OZs can be found at https://www.cdfifund.gov/Pages/Opportunity-Zones.aspx
A brief stylized example will help clarify how OZs work. Suppose an investor enters into a 2018 sale that generates a $1M. capital gain. Within 180 days, the investor contributes this gain to a Qualified Opportunity Fund (QOF). Originally, the investor has a $0 basis in the QOF.
The gain on the first sale is deferred until the earlier of:
- Date of next sale or exchange, or
- December 31, 2026
As always, given the time value of money, taxes deferred are taxes reduced. In addition to this deferral, some of the gain is forgiven. Specifically, there are two provisions that further reduce effective taxation of the existing (pre-QOF) gain, and one that reduces – well, eliminates – taxes on any gain from the QOF itself:
- There is a 10% step up in QOF basis, if held for 5 years
- There is a 15% step-up, if held for 7 years.
- If held for 10 years, gain from the QOF is forgiven.
In most cases, it’s the third bullet point that is likely to be the largest tax break, if the new investments are successful. For example, assume the new investment is held for a full decade or more. At the end of 2026, the investor is liable for capital gains tax on 85% of the original $1M gain, and the basis is then increased to the original $1M gain. Suppose the investor sells in 2028, after 10 years, for market value, say $2M. After 10 years the new basis is the market value, so no tax is due on the additional appreciation.
Possible Pros and Cons of Opportunity Zones
The example above illustrates the “pro” of OZs from an investor’s perspective. If an investment is held for a decade, and the assets appreciate, the OZ structure will reduce capital gains taxes, under some scenarios quite substantially. But there are other perspectives to be considered, e.g. the taxpayer’s perspective, the perspective of the residents of the tract, and also that of the neighbors. We should be concerned with the efficiency of the program, but also equity and fairness, a point made eloquently by Senator Booker in his interview with Professor Davis.
Since the program is just starting up, there is not yet any data or rigorous evaluation. But we can at least raise some questions and form some hypotheses for later testing.
First, what are some of the potential advantages of OZs, what are some positives we should look for and measure in any of evaluation?
- From a public policy perspective, the promise of OZs lies in the hundreds of billions of dollars in unrealized capital gains held by U.S. taxpayers, some of which are potential sources of funds for Opportunity Zone investments. In the event, how much new investment is generated?
- Since OZ reduces capital gains, successful, patient investments should be rewarded. How do OZ investments perform in practice, compared to market benchmarks?
- The focus on Census tracts should concentrate capital more than general capital gains relief would. Will this be reflected in higher measured impacts when the post-investment research tallies up the effects on tract employment, wages and other indicators, as well as investor returns?
- Investors have a stake in the neighborhood as well as their individual investment. Can we measure any positive externalities generated by these investments?
- Flexibility (business and real property) reduces government tendency to try to “pick winners.” What kinds of investments were made?
- OZs’ relative simplicity should attract investors. And there is no cap on OZ tax expenditures. It’s an entitlement. Is take-up of the program sufficient to make a difference in the tracts? Are there any unintended consequences from the absence of detailed regulatory oversight?
- A capital subsidy has the potential to raise labor productivity, and hence wages (though wages may be set in a wider labor market than a Census tract). And many OZ projects may be “high tech” enterprises that use little local labor. Do we see any appreciable relative movement in wages and compensation, especially for low-wage workers?
- To the extent that OZs do attract investment to distressed communities, how much might gains in employment and wages be counterbalanced by increased rents? Research and experience confirms that these countervailing costs can be minimized with the right balance of land use and development regulations.
- The limited number of tracts approved as OZs may improve program focus; but of course, the counterargument is that other low-income tracts are by design excluded. How does this tradeoff work in practice?
Other questions derive from potential shortcomings of OZ.
- Like any tax expenditure, the cost to taxpayer is real, if somewhat opaque. How large is this cost, and how does it compare to measured benefits?
- There is no cap on OZ tax expenditures. It’s an entitlement. Does the cost have any implications for the budget deficit, for the financing of other essential services?
- Current OZ rules require capital to be raised and deployed quickly. Given the length of time required to get regulatory approvals for truly new projects, will these rules prove counterproductive?
- A capital subsidy has the potential to shift some firms from hiring labor to hiring capital, reducing employment. Does this effect loom large, how does it stack up to gains in employment from increased investment?
- Do employment and/or wages in one Census tract grow at the expense of another, non-OZ but still distressed tract?
- Are there necessary collateral actions, public or private? For example, the Opportunity Zone program doesn’t directly address key infrastructure issues, or shortcomings in education, or fix inappropriate land use and development regulations.
- Inevitably, some unknown amount of Opportunity Zone subsidies will be provided to projects that would have been financed anyway at unsubsidized market rates. Economists refer to this as “inframarginal subsidies:” using taxpayer resources to pay investors to do what they would’ve done anyway if you hadn’t paid them. How widespread are such inframarginal (wasted) subsidies?
- Opportunity Zones can provide perverse incentives to invest where the social return to capital is actually lower. On the other hand, it can be argued they can kickstart a Census tract to a new higher rate of return for projects, to the extent there is interdependency among developments. Which effect dominates?
- Will benefits of the program be temporary? Or will these locations be put on a permanently new and higher growth path?
More generally, what are the mechanisms and institutions that will track and evaluate the program? Do they have the right expertise, the right data, sufficient resources? Do they have channels through which to communicate – in both directions – with policymakers, and with people on the ground (investors, employers, employees, neighbors)?
Final Thoughts
To circle back to our original metaphor, OZ is like a new wine, a new varietal produced for the first time in our vineyard. Right now we’re getting started, crushing the grapes, getting it into the barrels. Like a vintage wine, we won’t know for sure how tasty our new line is for a few years, and like a good vintner we’ll need to take some samples and do a little tasting, a little research, year by year as the program matures. Here’s hoping we end up with a really fine “wine,” a tasty new vintage of effective programs.
There’s a lot to think about as we start this program up, and a lot to learn as it’s implemented. Do take advantage of the Center’s website, both to get the big picture from Senator Booker, and a lot more detail from the wonderful panel of our ten experts.
Sources, and Further Reading
Abravanel, Martin D, Nancy M Pindus, Brett Theodos, Kassie Bertumen, Rachel Brash, and Zach McDade. “New Market Tax Credit (NMTC) Program Evaluation.” Washington, DC: Urban Institute, 2013.
Austin, Benjamin, Edward Glaeser, and Lawrence Summers. “Saving the Heartland: Place-Based Policies in 21st Century America.” Paper presented at the Brookings Papers on Economic Activity Conference Drafts, 2018.
Bartik, Timothy J. Jobs for the Poor: Can Labor Demand Policies Help? Russell Sage Foundation Publications, 2001.
Bernstein, Jared, and Kevin A Hassett. “Unlocking Private Capital to Facilitate Economic Growth in Distressed Areas.” Economic Innovation Group, 2015.
Busso, Matias, Jesse Gregory, and Patrick Kline. “Assessing the Incidence and Efficiency of a Prominent Place Based Policy.” American Economic Review 103, no. 2 (2013): 897-947.
Butler, Stuart M. “‘Supply Side’ in the Inner City Enterprise Zones in America.” Built Environment (1978-) (1981): 42-49.
Campion, Sean. “Tax Increment Financing: A Primer.” Albany, NY: Citizens Budget Commission, 2017.
Carroll, Rachel Reilly. “Opportunity Zones Program: An Early Overview of Program Details and What’s Ahead.” Enterprise Community Partners, Inc., 2018.
Chetty, Raj, Nathaniel Hendren, and Lawrence F Katz. “The Effects of Exposure to Better Neighborhoods on Children: New Evidence from the Moving to Opportunity Experiment.” The American Economic Review 106, no. 4 (2016): 855-902.
Fikri, Kenan, and John Lettieri. “From Great Recession to Great Reshuffling: Charting a Decade of Change across American Communities; Findings from the 2018 Distressed Communities Index.” Economic Innovation Group, 2018.
Forbes, Jennifer. “Using Economic Development Programs as Tools for Urban Revitalization: A Comparison of Empowerment Zones and New Markets Tax Credits.” University of Illinois Law Review (2006): 177.
Glaeser Edward, L., and Joshua D Gottlieb. “The Economics of Place-Making Policies.” Brookings Papers on Economic Activity, no. 1 (2008).
Government Accountability Office. “New Markets Tax Credit Appears to Increase Investment by Investors in Low-Income Communities, but Opportunities Exist to Better Monitor Compliance.” Washington, DC, 2007.
———. “New Markets Tax Credit: Better Controls and Data Are Needed to Ensure Effectiveness.” Washington, DC, 2014.
———. “Revitalization Programs: Empowerment Zones, Enterprise Communities, and Renewal Communities.” Washington, DC, 2010.
Greenbaum, Robert T., and Jim Landers. “Why Are State Policy Makers Still Proponents of Enterprise Zones? What Explains Their Action in the Face of a Preponderance of the Research?” International Regional Science Review 32, no. 4 (2009): 466.
Hall, Peter. “Enterprise Zones: British Origins, American Adaptations.” Built Environment 7, no. 1 (1981): 5.
Ham, John C., Charles Swenson, Ayse Imrohoroglu, and Heonjae Song. “Government Programs Can Improve Local Labor Markets: Evidence from State Enterprise Zones, Federal Empowerment Zones and Federal Enterprise Communities.” Journal of Public Economics 95, no. 7-8 (August 2011 2011): 779-97.
Hughes, James W, and Joseph Seneca. New Jersey’s Postsuburban Economy. Rutgers University Press, 2014.
Kain, John H, and Joseph J Persky. “Alternatives to the Gilded Ghetto.” The Public Interest, no. 14 (1969): 74.
Kline, Patrick, and Enrico Moretti. “Place Based Policies with Unemployment.” American Economic Review 103, no. 3 (2013): 238-43.
Kolko, Jed, and David Neumark. “Do Some Enterprise Zones Create Jobs?”. Journal of Policy Analysis and Management 29, no. 1 (2010): 5-38.
Malizia, Emil E, and Edward J Feser. Understanding Local Economic Development. Routledge, 1999.
Malpezzi, Stephen. “Cities and Economic Success: Some Lessons from the United States.” Report to Cities and Communities/Infrastructure Canada, 2007.
Molloy, Raven, Christopher L Smith, and Abigail Wozniak. “Internal Migration in the United States.” The journal of economic perspectives 25, no. 3 (2011): 173-96.
Neumark, David, and Jed Kolko. “Do Enterprise Zones Create Jobs? Evidence from California’s Enterprise Zone Program.” Journal of Urban Economics 68, no. 1 (2010): 1-19.
White, Sammis, Richard Bingham and Edward Hill, ed. Financing Economic Development in the 21st Century: M.E. Sharpe, 2003.
Zangari, Ted, and Jaime Reichardt. “(a Big) Opportunity Knocks.” ROI-NJ.com, 2018.
———. “Federal Opportunity Zones.” In Presentation to the Rutgers Real Estate Center Conference on Opportunity Zones: Sills Cummis & Gross P.C., 2018.