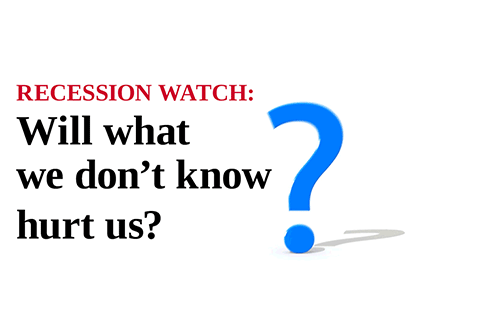
So far, so good for 2019. But questions lurk.
Nearly all private sector forecasters and policy makers are forecasting a slowing in economic growth in the US and elsewhere in 2019. The expected slower performance is development in the later stages of an economic cycle, indeed it was delayed in the US last year by the sugar rush from fiscal stimulus even as it started to take hold abroad. Now with US monetary policy at more of a neutral stance and the fiscal stimulus fading, the US economy is expected to cool too. At the same time, clouds have gathered on the horizon from intensifying uncertainty over trade, fiscal policy and geopolitics that threaten to turn a late cycle slowing from a soft landing into a recession. Leading indicators, including financial conditions and the performance of interest sensitive sectors will provide early indications of whether the US and global economies are gliding into a soft landing or a more worrisome negative feedback loop is taking hold. To date, leading indicators confirm the expected slowing is underway but suggest that it is likely to be relatively benign. The exception are measures of policy uncertainty that have spiked in the US and China and threaten to reinforce the cyclical slowing. The timing and magnitude of the impact of policy uncertainty varies over time depending on how it combines with other developments and when and whether the sources of uncertainty are resolved. We expect that patience on the part of global monetary policy makers and Chinese fiscal stimulus will combine to keep the US and global economies in soft landing territory, but naturally the uncertainty around that forecast is higher than usual.
Follow the Leaders
GDP growth and employment are generally thought to be concurrent measures of the health of the economy. However, a number of measures are thought to lead the broader economy. A commonly referenced index based upon ten leading indicators is published by the Conference Board every month. The indicators in the index include average manufacturing weekly hours, weekly initial claims for unemployment insurance, three measures of new orders for manufactured goods from consumers and firms, building permits for housing starts, the S&P 500 stock index, an index that gauges pricing and availability of credit, a measure of the slope of the yield curve, and a measure of consumer expectations. Figure 1 highlights that the Conference Board’s index of leading indicators has declined slightly over the past three months. The decline was broad based with most components of the index either making less positive contributions or declining outright. The chart highlights that the index has tended to decline steadily for more than a year before the start of a recession, so it is worth keeping an eye on the index to determine whether the recent deterioration persists of levels off and rebounds like in 2016 or 2012.
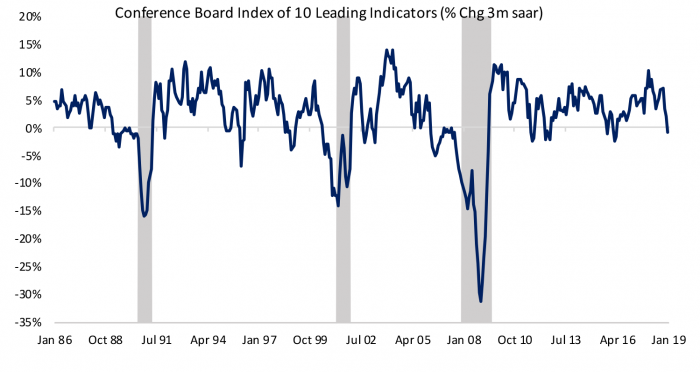
Source: Conference Board, Haver Analytics
Don’t be so Sensitive
The Fed’s goal in raising interest rates is to slow the economy down and prevent overheating either in the form of inflation or asset bubbles that may get out of control and can become a disruptive force. Interest sensitive sectors are therefore usually be the first to respond to tighter monetary policy, including demand for housing and autos. These sectors have indeed responded to higher rates over the past year with auto sales essentially flat in 2018 from 2017 and new and existing home sales down nearly 7% through November (Figure 2). With the Fed on hold but not poised to cut rates any time soon, demand for housing and autos is likely to remain subdued and these sectors are unlikely to contribute to and may in fact weigh modestly on GDP growth in 2019. This is not a problem per se but is part of the Fed’s strategy for achieving a soft landing. Soft landings are historical oddities, although it is worth noting that flexible policy makers have helped Australia avoid a recession for the past 27 years. So it is possible!
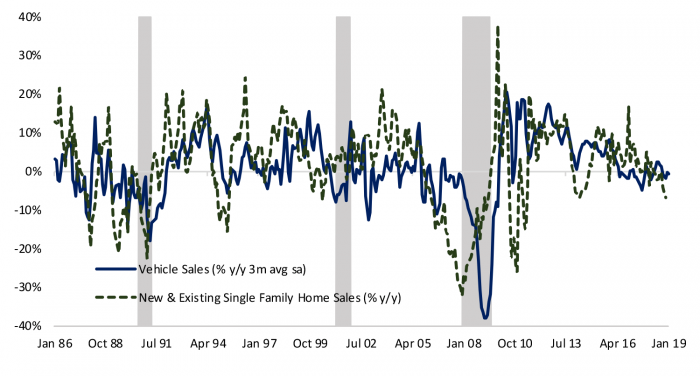
Source: Bureau of Economic Analysis, Census Bureau, National Association of Realtors, Haver Analytics
The Only Thing Certain is Uncertainty
One of the intensifying risks to the outlook is uncertainty over economic policy. Trade policy is the epicenter of threats to economic decision making, from the open-ended trade war with China to the potential for auto tariffs imposed by the US to the possibility that the recently negotiated USMCA between the US, Canada and Mexico doesn’t pass Congress this year to the reshaping of global trade that would come with Brexit. Adding to uncertainty from trade policy is the fiscal dysfunction in the US that led to the longest federal government shutdown in history in recent months, rising populism in Italy and France, and intensifying authoritarianism in China.
Economists have identified the channels through which uncertainty about economic policy can affect the economy. Former Fed Chair Ben Bernanke developed a model in the 1980s that described how an environment of heightened uncertainty implies a tradeoff between reaping the rewards from making longer-term investment decisions earlier versus the benefit from waiting until new information clarifies the rules of the road. Researchers that have looked specifically at trade between China and the US found that the entry of China into the WTO in 2001 reduced uncertainty about potentially disruptive trade conflicts bringing forward investment and lowering prices even before any actual reduction in tariffs or the signing of agreements. The risk is that we now see rising uncertainty lead to delayed investments and slower growth.
Three economists developed global measures of economic policy uncertainty based on media cites that can be used to assess the risk to the economy. They found that “policy uncertainty is associated with greater stock price volatility and reduced investment and employment in policy-sensitive sectors like defense, health care, finance, and infrastructure construction. At the macro level, innovations in policy uncertainty foreshadow declines in investment, output, and employment in the United States.” Figure 3 shows their global index which reached the highest level recorded on a 3-month average basis in January (the series only goes back to 1997) driven by spiking uncertainty in China and the US, the two largest economies in the world. Uncertainty isn’t the only thing that matters to firms and households, and the timing and magnitude of its impact varies over time depending on how it combines with other developments. The worry is that rising uncertainty about trade and fiscal policy will reinforce a slowing that is naturally underway for cyclical reasons producing a more self-reinforcing negative feedback loop.
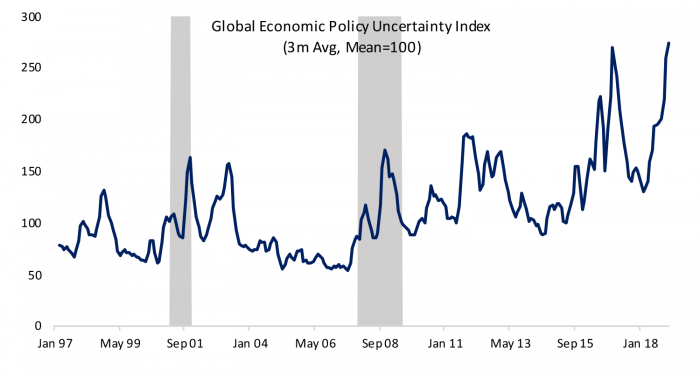
Source: PolicyUncertainty.com, Haver Analytics
Indicators on investment and hiring will provide early indications that rising uncertainty is starting to lead to increased caution, although it may be difficult to disentangle the expected cyclical slowing from a more worrisome recessionary dynamic. There was some slowing in capital investment in the second half of last year, although data from Q4 is still unavailable due to the government shutdown. Meanwhile there have been no indications of increased trepidation in hiring, which has been going gangbusters in recent months with people sidelined during the Great Recession coming back to the labor force in droves. The US labor market gives the economy a solid base to start the year with despite elevated policy concerns.
Another channel that could lead to a more recessionary dynamic would be a prolonged tightening in credit conditions. Figure 4 shows recession probabilities from a model developed by researchers at the Fed that is based on credit spreads. It also shows the share of banks responding to the Fed’s Senior Loan Officer Survey who reported increasing spreads on commercial and industrial loans. The net share of banks tightening spreads on bank loans became positive for the first time since 2010 in Q1 and the Fed’s model of recession probabilities was 19% in January, down from 28% in December but still above the 14% average for 2018. Neither measure looks particularly worrisome at this stage but both bear watching.
In response to the rising tide of uncertainty, policy makers at the Fed and central banks around the world have shelved prior plans for continued tightening. The policy shift has buoyed market sentiment, which can short-circuit the transmission of uncertainty into the economy. In addition, the US still has some tailwinds from fiscal stimulus and China has embarked on a course of easing. The current recovery in the US still has a good shot at becoming the longest post World War II expansion (it will hit this mark in Q3), in part based on policy makers’ patience; but uncertainty about what we don’t know can hurt us.
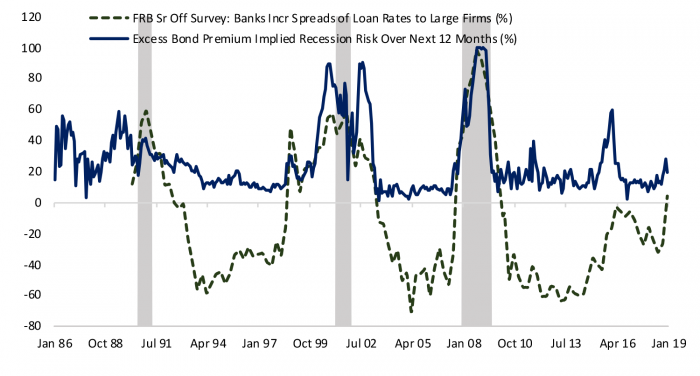
Source: Federal Reserve, Haver Analytics