
Younger households are borrowing less. Why?
Real household debt per capita started growing again in 2014 after roughly seven years of decline as many homeowners either defaulted on or paid down mortgages during and after the housing crisis. However, the pace of borrowing doesn’t exceed either income growth or appreciation in wealth, suggesting either a greater degree of consumer caution or tighter lending standards than prevailed in the 2000s ahead of the financial crisis. A recent research paper documents that nearly the entire net increase in debt since 2003 has been among older households, particularly wealthy households aged 70 and over. Meanwhile households under 35 have seen an outright decline in per capita debt balances, with a strong tilt away from mortgages toward student loans. Other research has drawn a causal link between rising student loan debt and declining homeownership, closing off the traditional entry into wealth building for many younger households. While the good news is that rising household debt does not appear to pose a threat to the financial wellbeing of US households, the bad news is that the lack of borrowing among younger households may be a reflection of a lack of financial prosperity.
Household Debt has Started Rising Again
Since Q3 2016, every time the Federal Reserve releases the Financial Accounts of the United States, there are headlines trumpeting that household debt has reached a new record high. In a country with a growing population and economy, healthy capital markets and a positive rate of inflation, the fact that debt is also growing provides no information about the health of households or the broader economy. Yet a focus on household debt is understandable after having suffered the greatest financial crisis since the Great Depression in 2008, an event tied directly to unsustainable household debt.
Figure 1: Household Debt Has Doubled Since 1989
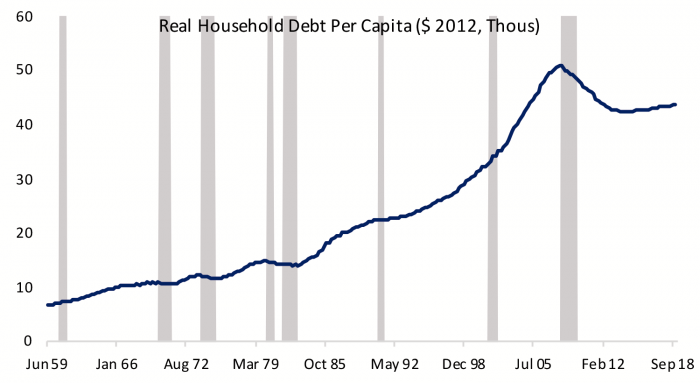
Figure 1 shows that controlling for inflation and population growth, real household debt per capita started growing again in 2014 after roughly seven years of decline as many homeowners either defaulted on or paid down mortgages during and after the housing crisis. Household debt per capita in 2012 dollars stood at $43,730 at the end of 2018, down from the peak of $50,839 reached just before the housing bust, but double what is was in 1989. As debt resumes growing from levels that are still historically elevated by historical standards it is worth evaluating the risks it poses to the financial health of US households.
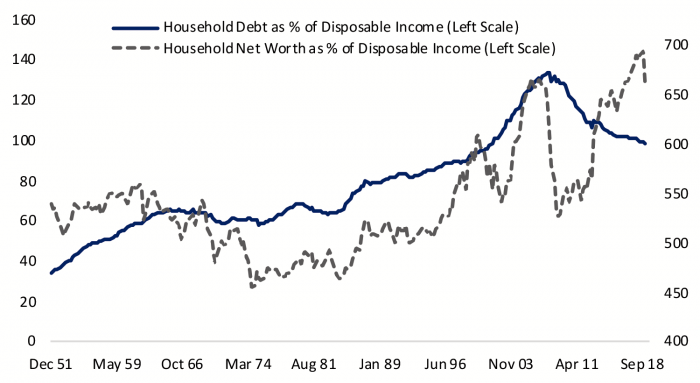
Figure 2: Households Are Borrowing Against Rising Incomes and Appreciated Assets
Incomes and Asset Values are Growing Faster than Debt
Households access financing by demonstrating the ability to repay through the strength of their income or assets. Figure 2 illustrates that scaling debt either by income or household net worth paints a considerably more sanguine picture than looking at debt alone. Debt as a percent of disposable income has risen 25% on balance since 1989 but it has fallen 26% from the peak reached in 2007 and stands at the lowest level since 2001. Meanwhile household net worth fell back in Q4 2019 but still stands close to record highs. While household borrowing has resumed after a period of post crisis deleveraging, the pace of borrowing doesn’t exceed either income growth or appreciation in household real estate and financial assets suggesting a greater degree of either consumer caution or tighter lending standards than prevailed in the 2000s ahead of the financial crisis.
Figure 3: Debt Payments are Not a Rising Claim on Household Income
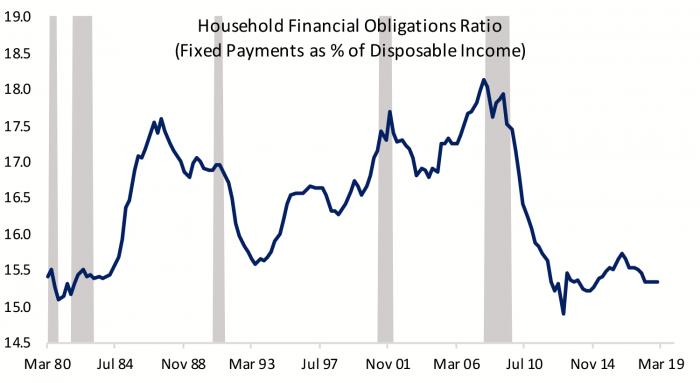
Lower interest rates also mean that households aren’t paying more to service their rising debt. Figure 3 shows the financial obligations ratio for the US, calculated as required payments on outstanding mortgage and consumer debt as well as automobile lease payments, rental payments on tenant-occupied property, homeowners’ insurance and property tax payments as a percent of disposable income. Fixed payments have accounted for close to 15-1/2% of disposable income in the aggregate in recent years, roughly the same fraction as in the early 1980s when households held a third of the debt they now hold. Households are certainly more vulnerable to rising interest rates, but it increasingly appears that low rates are more of a structural than a cyclical phenomenon.
Figure 4: No Indications of Rising Difficulty Servicing Debt
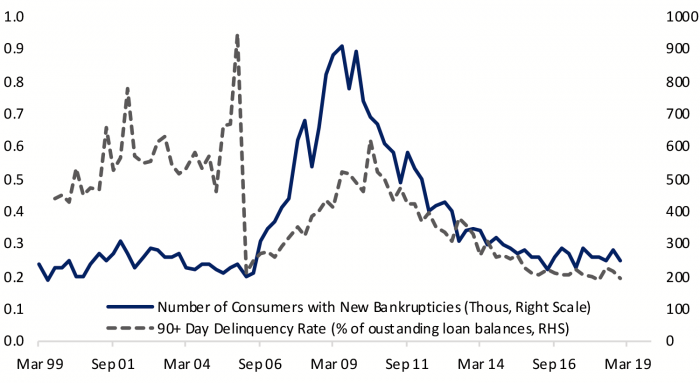
It is worth looking under the hood to see if this general picture of financial health masks distress among individual households. Wealth and income are increasingly concentrated and lower-income households may not be benefiting as much from the rising tide of asset values and wage gains. Figure 4 illustrates the number of bankruptcies and the percent of loans outstanding with delinquencies of 90 days or more. Both measures of financial distress have declined substantially since the Great Recession and remain near cycle lows. There is little indication in these measures that household borrowing is nearing the same kind of irrational exuberance we saw in the housing boom that led to a broad pullback in consumer spending. We don’t know whether this is because households have chosen to be more prudent or banks have resisted the urge to loosen standards as the cycle proceeds, but the conclusion of broad-based household financial wellbeing is the same regardless of the cause.
A Generational Shift in Debt
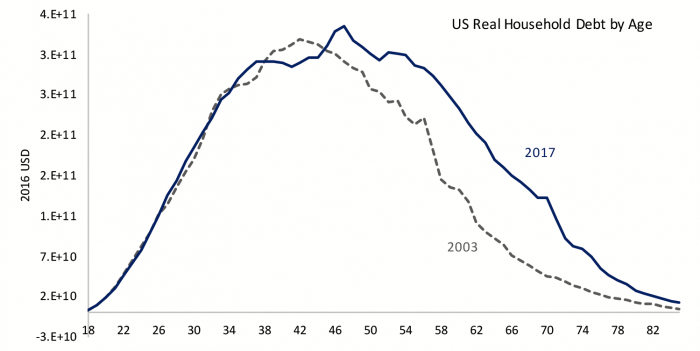
A recent conference sponsored by the Pension Research Council at Wharton focused on growing household debt and its implications for retirement security. A paper titled “The Graying of American Debt” presented by researchers at the New York Federal Reserve and Stony Brook University used household-level data from credit reporting agencies and surveys to document the net increase in real household debt between 2003 and 2017. Figure 4 illustrates the authors’ findings that nearly the entire increase in debt over the past two decades has been among older households aged 55 and over. The authors decomposed how much of the increased debt was due to the fact that the older cohort is getting larger as the baby boom generation ages and how much reflects a change in the way households borrow. They found that particularly for households in their later 60s and 70s most of the increase in debt reflected changing behavior and an increased desire to borrow against real estate. Households in these age groups are now carrying more than twice the debt into their later retirement years. Yet the authors found no indications of increased financial distress in the form of rising delinquencies or defaults and that the increase in debt is concentrated among households at the top of the wealth distribution.
Figure 5: The Rise in Household Debt Has Been Concentrated Among Older Households
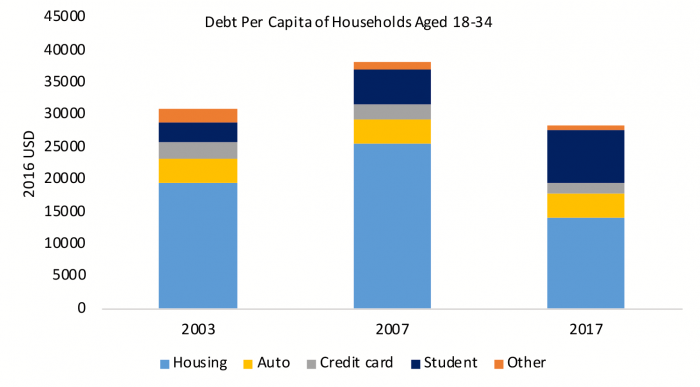
The relatively sanguine finding of increased debt among the wealthy elderly contrasts with a potentially more disturbing trend. In a finding that will surprise no millennial anywhere, the authors documented a decline in the real amount of debt carried by households aged 18 to 34, but a notable shift in the composition with more than a doubling in student loan debt per capita and a decline in mortgages (Figure 6). Debt is often thought of in negative terms, but for many households the ability to borrow to buy a home is their entry into wealth building. A study by the Federal Reserve Board found a causal link between rising student loan balances and declining homeownership rates among young adults. Delinquencies on student loans are also much higher than for mortgages and other types of consumer debt, confirming a generational tilt in creditworthiness that will continue to hamper millennials.
Figure 6: Millennials Carry More Student Loans and Fewer Mortgages
The good news is that the return to rising household debt does not appear to pose a threat to the financial wellbeing of US households. In the aftermath of the financial crisis the banking sector has returned to health and profitability by tilting its lending toward wealthy elderly households who seem interested in borrowing against their appreciated real estate. Meanwhile the lack of debt growth among younger households may be an indication of a lack of financial health. It is not surprising that proposals to reduce student loan debt are on the rise, and such proposals could lead to a tilt in debt back towards mortgages should millennials channel some of the resulting borrowing capacity into homeownership.