
Boom and bust hits a forecasting variable economists used to bank on
Consumer net worth is now a standard input to macroeconomic forecasting models, and recent record highs have added to policy makers’ confidence in the outlook. Since wealth is something households intentionally accumulate through savings to finance future consumption, it wasn’t a key forecasting variable until we entered the era of booms and busts in asset prices. The wealth effect on consumer spending really refers to unanticipated gains in wealth, and it was born in the stock market boom of the late 1990s and became a source of concern during the leverage fueled housing boom. Recently it appears the wealth effect may be losing its potency.
What is the wealth effect?
Household net worth has been a standard input to macroeconomists’ forecasts of consumption and GDP for decades. Indeed, our very own Dr. Morris Davis wrote the how-to manual for incorporating household net worth into forecasting models of consumer spending way back when he was an up and coming economist at the Federal Reserve Board. More recently Federal Reserve policy makers, no doubt with the output of precisely the type of model described by Dr. Davis and his co-author have pointed to record levels of net worth as one reason for confidence in the outlook. In her June press conference Chair Yellen described consumers’ “solid fundamentals” including “ongoing improvement in the job market and relatively high levels of consumer sentiment and wealth.”
While it may seem intuitive the rising household wealth would support stronger consumer spending, the causality in the permanent life cycle model of consumer behavior actually goes the other way. Consumers have an endowment of human capital, which is a convoluted way of referring to a person’s lifetime earning potential based on their talent, the education they acquire, and a healthy dose of random chance and circumstances. People may inherit wealth, and they make decisions about how much to borrow in their younger years, save in their peak earning years and draw down their saving in their elderly years to maintain a relatively smooth standard of living across their lives. In this standard framework, rising wealth comes from planned saving decisions and expected returns on that saving. Wealth accumulation is planned to finance consumption down the road and should have no independent, causal effect on consumer spending.
MIT economist Jim Poterba motivated his 2000 review of the growing body of research on wealth effects on consumption by pointing to the vast accumulation of wealth driven by the stock run up of the late 1990s.[i] Poterba pointed to the more than 50% appreciation in real household net worth that occurred mainly in the latter part of the 1990s; arguably some part of such a massive appreciation was likely above and beyond what investors expected to earn when they saved their money and bought stock, and therefore it is like manna from heaven and can have an independent, causal impact on consumer spending decisions. In the forecasting framework described in Dr. Davis’ paper there is a long-run relationship between wealth and spending and if wealth grows more than expected, consumption will move up to that new level to keep that long-run relationship aligned.
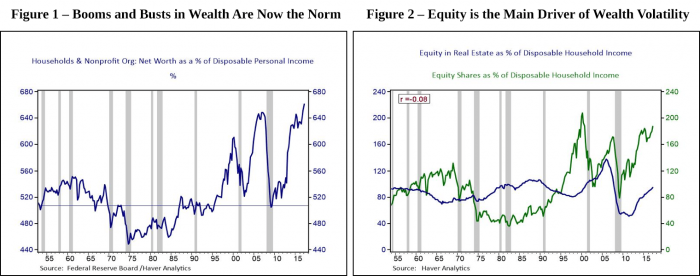
Figure 1 highlights that the post-war period was not characterized by wild swings in household balance sheets prior to 1995. Net worth was relatively low in the 1970s and higher before and after, but wealth swings did not coincide with business cycle fluctuations. The horizontal line in the chart is 507%, the 40-year average ratio of household net worth to disposable income prior to 1995. Since 1995 business cycles have been closely aligned with fluctuations in financial asset values.
In the 1990s research was focused on wealth effects from the stock market boom, and it sought to identify the magnitude by comparing the consumption behavior of stock holders and non-stockholders over the time of the massive market appreciation.[ii] The concentration of stock ownership, and therefore the accrual of gains was well understood even then. The Survey of Consumer Finances shows that the percent of families in the top income decile that owned stock rose from 77% in 1990 to 90% at the end of the decade, and median holdings nearly quadrupled from $73k to $284k. In the middle income quintile the percent of families owning equity directly or indirectly though 401ks or mutual funds rose from 30% to 51% while median holdings rose from $8k to $18k. In the bottom income quintile equity holdings are trivial. The concentration of gains does not imply that the stock market boom wasn’t relevant for macroeconomic consumption forecasting since the wealthy households that own stock account for a disproportionate share of consumer spending. A rule of thumb emerged from the research of the 1990s that in the aggregate consumption would be boosted over time by three to five cents for every dollar of unanticipated gain in stock market wealth.
From the Frying Pan into the Fire: Stock Bubble to Housing Crisis
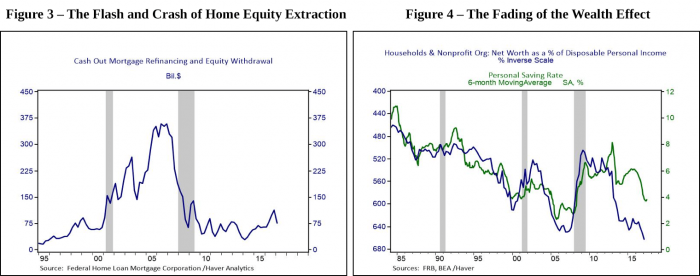
Even as the NASDAQ plunged 60% in one year from Q1 2000 to Q1 2001 and kept declining, housing prices were already taking the baton. The CoreLogic Home Price Index rose 10% in 2001 moving up to a 15% annual pace by 2005. Importantly a number of erroneous assumptions by bankers, consumers and real estate professionals along with a plentiful inflow of foreign capital allowed a self-reinforcing cycle of leverage to drive valuations ever higher. Figure 2 illustrates that rising home values helped attenuate the impact of falling stock values making the recession of 2001 relatively shallow and short-lived. As the recovery proceeded continued home price gains marched alongside a recovery in equity markets boosting overall net worth to new records in five short years.
Policy makers at the Federal Reserve cast a wary eye during the housing boom on the large sums of home equity being extracted through cash out refinancing and home equity loans and lines of credit. Figure 3 illustrates that at the peak of the housing boom consumers were extracting $300bn or more per year in cash from their homes, an amount capable of financing more than half of all consumer spending growth during those years. In 2007 then Vice Chair and senior staff economist Karen Dynan wrote a paper titled “The Rise of US Household Indebtedness: Causes and Consequences” that concluded that “U.S. households have become more exposed to shocks to asset prices through the greater leverage in their balance sheets; a given change in stock prices or home prices will have a larger effect on net wealth and so on spending”. Nonetheless there was still a strong sentiment amongst the leadership at the Fed at the time that market forces wouldn’t facilitate such leverage if there wasn’t a sound rationale. It couldn’t be ruled out that consumers were sensibly availing themselves of very attractive financing opportunities and home valuations could in fact be sustainable.
Evidence of a strong wealth effect was everywhere during the housing boom. If consumers are spending out of wealth instead of income then the personal saving rate should decline. Effectively consumers judge that the magnitude and staying power of capital gains on their homes and equity portfolios mean they can still save a little less than they might have previously planned. Figure 4 shows the personal saving rates against the inverse of the ratio of net worth to disposable income. The saving rates declined steadily through the 2000s as wealth rose. Researchers tried to separately identify stock and housing wealth effects and pondered at the role of leverage or possible asymmetries in reactions to rising versus falling asset values.[iii] As we all know now, the additional influence of leverage in the housing bust did in fact accentuate the wealth effect in reverse contributing to the depth and severity of the Great Recession.
Now we stand at yet another record high in asset values and household net worth. Yet this time it seems consumers are behaving a bit more cautiously. Consumer leverage continues to be steady to drifting slightly lower as a share of disposable income and Figure 4 highlights that while the saving rate has declined in the past two years, it hasn’t come down nearly as much as the prior two cycles would lead forecasters to expect. In the now standard forecasting models for consumption, this misalignment in the long-run relationship between wealth and consumption should signal rising consumption. Some researchers have argued that the misalignment that we are currently observing may instead be an indication that asset values themselves are out of line with long-run fundamentals and are likely to correct downward.[iv] In my next blog post I will explore the various reasons the wealth effect may be smaller than in the past, including demographic reasons, tight credit conditions, a greater appreciation of risk, and increased uncertainty about the future.
[i] See Poterba, James, “Stock Market Wealth and Consumption”, Journal of Economic Perspectives, Volume 14, Number 2, Spring 2000.
[ii] See Dynan, Karen and Maki, Dean, “Does Stock Market Wealth Matter for Consumption?” Federal Reserve Working Paper 2001-23, May, 2001.
[iii] A good review of the literature including housing can be found in Cooper, Daniel and Dynan, Karen, “Wealth Shocks and Macroeconomic Dynamics”, Boston Fed Policy Discussion Paper 13-4, June, 2013.
[iv] See Lettau, Martin and Ludvigson, Sydney, “Understanding Trend and Cycle in Asset Values: Reevaluating the Wealth Effect on Consumption”, American Economic Review 94-1, 20014.