
The economy is booming, but it’s not contributing. How come?
Residential investment has been missing in action as a contributor to GDP growth over the past year despite an otherwise stellar performance. Even as the long-awaited move by millennials into home ownership gets underway, shifting cultural attitudes toward cohabitation and child bearing point to a persistently slower pace of household formation. Booming GDP and hiring also belie underlying economic anxieties among the younger generation and lower-income household about rising housing and child care costs that in turn affect decisions about household formation. Investment in housing doesn’t look poised for a decline given a strong economy, but the best days of the sector as a driver of GDP are likely behind us.
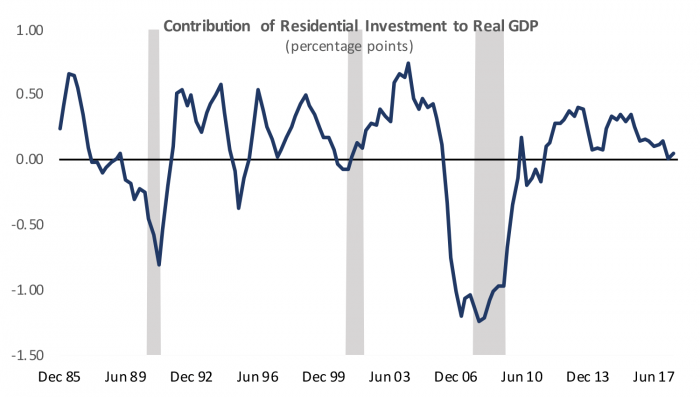
Residential Investment is Slowing as the Cycle Matures
Housing was a laggard in last week’s otherwise stellar GDP report. Residential investment was a very slight drag on GDP growth in Q2 and has contributed essentially nothing to growth on average over the past four quarters (Figure 1). Making no contribution to growth simply means that the level of overall construction and sales activity is leveling off, not that it is declining. Single-family construction accounts for just over a third of overall residential investment, down from an average of roughly 50% between World War II and the housing crisis of 2008. Single-family construction continued to grow at a modest pace over the past four quarters, making a small contribution to growth.
Improvements to existing homes, including additions or upgrades, make up another third of residential investment and real investment by homeowners and investors in improvements to existing properties grew at a moderate 5% pace over the past year, also making a small, positive contribution to GDP growth.
Brokers’ commissions on the sales of new and existing properties are the third largest category of residential investment at about 20% and have been declining modestly as the pace of home sales has fallen across all regions except the South over the past year. The construction of multifamily housing accounts for just under 10% of residential investment and has also been declining in recent quarters.
Housing is one of the most interest-sensitive sectors in the economy and it typically loses momentum as the Fed raises interest rates late in an economic expansion. Rates in 30-year fixed-rate conforming mortgages have risen to 4.5% on average so far this year, from 4.0% in 2017. From a cyclical standpoint it is not terribly surprising that the pace of residential investment is slowing. However, there are also structural signals from the recent slowdown that shed light on recent debates and highlight new challenges for policymakers.
Figure 1: A Normal Cyclical Slowdown in Residential Investment is Underway
The Great Millennial Housing Boom is More of a Bump
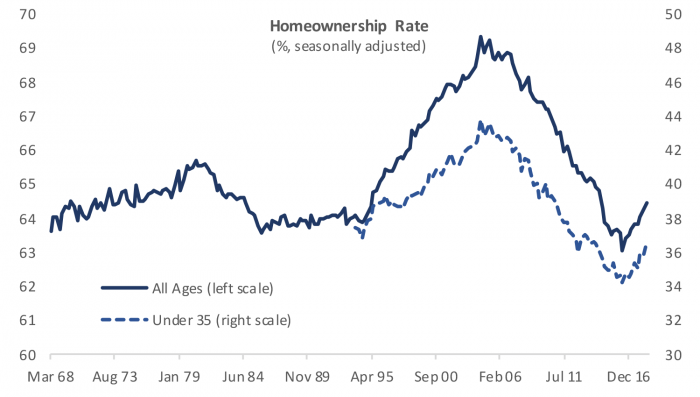
Optimists on the housing market have long pointed to the aging of the large millennial generation as a potential spark for a late-cycle pickup in housing. The millennials were born between the early 1980s and the mid to late 1990s and many are therefore moving into their 30s when homeownership rates start to rise. The millennials are aging just as the job market is strengthening, potentially facilitating a long-awaited pickup in household formation and a wave of demand for new housing units. Figure 2 confirms that as the millennials age, the homeownership is indeed on the rise for households where the head is aged 35 or younger. The stabilization in homeownership after a decade of decline is not unique to millennials; all age groups are seeing homeownership rates stabilize or tick up leading the overall rate to return closer to historical norms.
Figure 2: Homeownership Stabilizing on Millennial Demand
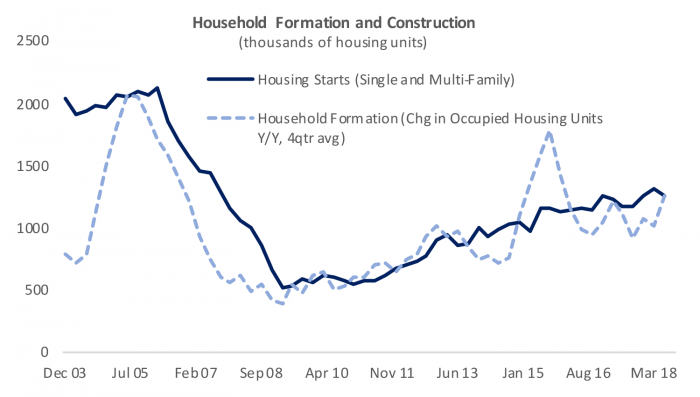
Whether people choose to own or rent their homes isn’t the essential driver of residential investment. Construction activity is driven by the formation of new households, and their choice of housing will drive what types of housing units are constructed. Figure 3 shows that the pace of new household formation has remained stubbornly subdued at just over 1mn new households each year with only a modest uptrend visible. The current pace of overall construction activity is well aligned with the need for new housing stock so that the shifting desire of millennials to own homes means reduced demand for rental units rather than a need for a faster pace of overall residential investment.
Cultural Changes Affect Housing and Vice Versa
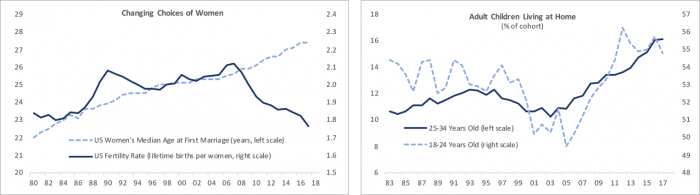
There are a number of data points that suggest changing preferences, culture and housing costs may help explain why household formation has remained subdued despite a strong labor market and improved household optimism about future earnings and financial situation. Figure 4 highlights several trends thought to be at least to a significant degree the cyclical reflection of the severity of the Great Recession but show no signs of reversing despite a strong economy. The left panel shows the percentage of young adults aged 18 to 24 and 25 to 34 living with their parents. The share of the youngest adults living at home rose during the Great Recession from a low of 49.5% in 2005 at the peak of the housing boom and homeownership to more than 56% in 2012 and has hovered in a range close to 55% since. Perhaps more emblematic of structural change in housing choices is the persistent rise in the share of 25- to 34-year-old children living at home, which reached an all-time high of 16% in 2017. Given rising labor force participation rates, falling unemployment and rising wages, the decision to share housing between generations can no longer be considered a signal of distress.
Figure 3: Stubbornly Subdued Household Formation Means Modest Construction Activity
The right panel of Figure 4 illustrates that younger women are making different choices about their lives that likely slow the pace of household formation. The median age of first marriage has been steadily rising for decades, with a slight acceleration in the trend since the Great Recession. At the same time the fertility rate has plunged since the peak of 2.1 lifetime births per woman in 2007 to 1.76 in 2017, an all-time low. The birth rate is currently below the estimated replacement rate of 2.1 births suggesting the population will eventually begin to shrink unless the US maintains a robust pace of immigration. The New York Times recently conducted a survey of men and women aged 25 to 45 asking young adults either why they didn’t plan on having children or why they expected to have fewer children then they considered ideal. The reasons cited for not planning on having children were a mix of preferences (36% want to enjoy leisure time, 30% have no desire for children) and economic circumstances (31% can’t afford childcare, 24% can’t afford a house). Economic considerations were even more prominent for those planning on having fewer children than they considered ideal with 64% reporting that childcare is too expensive, 49% citing worries about the economy, and 44% stating that in general they simply can’t afford more children.
Figure 4: Changing Demographics and Culture Mean Changing Housing Choices
The survey results suggest that the booming GDP and job numbers belie continued economic insecurities that are prevalent enough to affect trends affecting marriage and children with ramifications far broader than the housing market. Housing costs may have a causal influence in the demographic trends. The aggregate data are somewhat contradictory on this front. On the one hand housing costs have consistently risen faster than overall inflation during much of the post-war period. Shelter inflation has outpaced overall consumer inflation as measured by the Consumer Price Index by an average 0.4% over the past thirty years, suggesting people are having to devote an increasing share of their budget to housing.
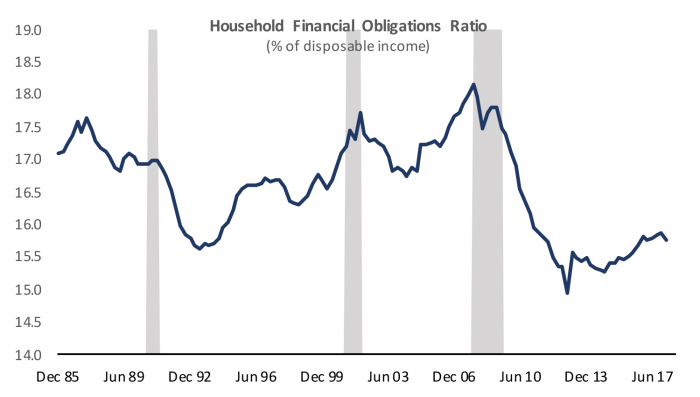
This contrasts with the Federal Reserve’s measure of the debt service burden, which includes rental and mortgage payments as well as car payments and other debt service which fell during the housing crisis on massive debt default and has remained lower than historical averages (Figure 5). Recent research from the Fed helped resolve the conundrum. The research looked at household payment demands including mortgages, rents and other types of debt service. The Fed researchers found that overall household payment requirement have fallen since the Great Recession for households above the median, but that household payment requirements have risen for households below the median household income even as homeownership rates continue to decline. The results suggest that access to homeownership has helped higher income households keep a lid on household payment burdens through the benefit of lower mortgage rates even as households below the median have seen rising rents eat up a greater share of their income.
Figure 5: Household Fixed Payment Burdens Have Declined in the Aggregate Over Time
Even for higher income households there is a potential for intergenerational inequality to intensify and rising housing costs to crowd out other types of spending and investment for younger generations. Recent research published in the American Economic Journal found that 25% of the college wage premium between 1980 and 2000 was absorbed by higher housing costs as college-educated workers need to locate in large cities that also tend to have building restrictions and rapidly rising rents. The erosion in the return to higher education has likely accelerated since the Great Recession given the rapid growth in rents this cycle. Thus, even higher-income younger workers may have to devote an increasing share of their budget to rent, which may in turn affect their ability to save for a down payment to purchase a home and their ability to afford enough space for a growing family and to pay for childcare.
It is no surprise that residential investment is slowing as interest rates rise and the economic cycle matures. The long-awaited move into homeownership by millennials may not result in the hoped-for second wave of contribution to growth from housing, not only because of rising rates, but also in light of developing trends in cohabitation and changing plans for family formation. These changes are partly cultural in nature but may also reflect to some degree the rising cost of housing for young and lower-income households. My fellow blogger, Dr. Steven Malpezzi, wrote a series of blogs on the myriad policies that policy makers can implement to address shortages in affordable housing, but they are generally local in scope and there may not be enough effective policies put in place in time to stimulate a significant increase in household formation among millennials in the aggregate.