
Housing, interest rates and capital flows: impacts and interrelationships
Executive Summary: In four decades of studying housing markets, I’ve learned two things about today’s topic. First, everyone involved (myself included) believes interest rates have profound effects on housing and real estate markets. Second, nobody (myself included) has a clear and simple understanding of exactly what those effects are.
In this blog we’ll examine some of the relationships among housing markets, interest rates and capital flows. After a brief introduction to housing in the business cycle, we’ll take a look at three building blocks of our analysis: measuring housing prices, interest rates, and inflation. Then we’ll undertake some exploratory data analysis on housing prices and interest rates, and housing prices and capital flows. Those data will in turn motivate a brief examination of some recent research on these matters. We’ll wrap up with some discussion of future research directions.
Folk wisdom suggests that “when interest rates go up, house prices and housing starts go down.” The key takeaways of our analysis suggest that interest rates do indeed affect housing markets, but not always in the simple manner that folk wisdom posits. Following van Horne, to understand financial conditions, we need to study flows as well as rates. And studying relationships among those rates and flows and housing conditions is especially difficult, because it’s devilishly hard to unpack cause and effect.
Introduction
Last week our resident macroeconomist Dr. Julia Coronado analyzed economic conditions and their implications for future interest rates. Within her commentary Dr. Coronado suggested that the economy is approaching full employment by some measures (e.g. the “Phillips curve” relationship between inflation and employment). On the other hand, she noted that the economy remains fragile by some other measures (e.g. actual recent inflation, and several measures of expected future inflation in the near future.) In her view, developments in financial markets point to another small rise in interest rates coming soon, but Julia argues that today’s mixed outlook calls for a “data dependent” and cautious Fed approach for this year, as we look for more direct evidence of a strengthening economy.
I have little to add to Dr. Coronado’s persuasive macroeconomic perspective. Rather, in this post we’ll take a first look at how – and how much – interest rates and other financial indicators can, in turn, tell us about housing and other real estate markets.
Housing and the Business Cycle: An Overview
Until a decade or so ago, housing economists were deeply into their subject, but many “mainstream” academic macroeconomists were slow to fully recognize housing’s role in the economy, with some notable exceptions; see Leung’s (2004) survey, for example. Since then, unsurprisingly, the Great Financial Crisis and Great Recession, and their aftermath, have caught the attention of those recalcitrant academic macroeconomists. In contrast, central bankers and other policy-focused macroeconomists have long paid more attention to housing. Central bankers have long realized that as an interest-rate sensitive investment, with strong linkages to consumption and employment, housing is an important channel for monetary policy. Borio and McGuire (2004), Davis and Palumbo (2001) and Goodhart and Hofmann (2001) are good examples.
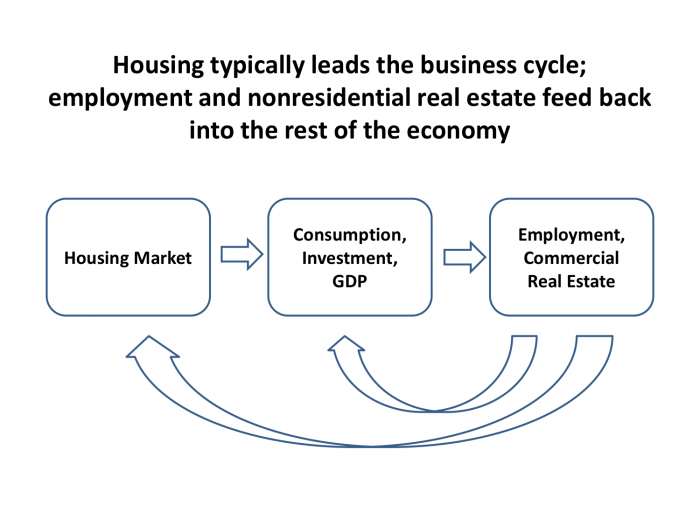
Exhibit 1
Exhibit 1 represents some of those linkages with a very simple schematic model of the U.S. economy. GDP comprises consumption and investment in a closed economy. The consumption and investment can be private, or government; we’ll focus on private in this blog, for simplicity. (Private consumption and investment comprise over 80 percent of the economy, and bringing in direct government spending and international trade wouldn’t add much to the points we’re examining here.)
Consider what is sometimes labelled a “garden variety” recession. In a business cycle, a common pattern is for housing investment to “lead” the cycle. Suppose the economy has been growing, but at some point, for some reason – overbuilding, high interest rates, aliens from outer space, whatever – housing investment tanks.
Housing investment itself is part of GDP, so GDP growth slows. But as construction workers are laid off, and people cut back on the purchases associated with house sales like furniture, lawnmowers and so on, the economy slows further. House sales (existing as well as new) slow down. Prices start to soften. Homeowners (two thirds of US households) begin to get nervous about the value of what for many is their largest asset. Consumption then starts to fall.
In the U.S., private consumption is the biggest chunk of GDP, usually comprising 65-70 percent of the dollar value in a given year or quarter. As consumption goes down, GDP falls. Firms see their sales fall; inventories may rise, but this is because they missed the turn in the business cycle, not because firms want to build stocks. Employers slow hiring, and increase the pace of layoffs. Firms are reluctant to investing in a new store, or warehouse, or sign a new office lease. Nonresidential real estate investment falls too.
At some point though, traditionally, the market turns, often as the Fed lowers interest rates. The housing market starts to right itself. Sales increase, along with furniture… and then the process works in reverse. Housing leads the economy out of the recession.
When we go into a severe recession, as in 2007-08, feedback effects may become especially important. When unemployment is high, for example, it may be harder for the housing market to get going again. Housing’s leading role may erode more than usual.
Of course this story is highly stylized. Any given actual business cycle is NOT that simple; but often this story is not too far from at least partial truth, as Green (1997) and Leamer (2007) point out. As we’ll see, the typical story is a very incomplete description of out last business cycle. While there are some real departures from the standard story to be discussed, housing still plays a central role. Let’s begin our exploratory data analysis with a look at house prices.
House Prices: A First Look
Malpezzi (2017) is one of many overviews of the Great Financial Crisis and Great Recession that argue that the causes were varied and layered and complicated; but that does not mean that every cause should be given equal weight. Primus inter pares was the early 2000s boom in U.S. house prices. Other causes, such as interest rates, land-use regulation, subprime lending, poor underwriting, high loan-to-value ratios, and so on, were sometimes deeper causes of house price rises; sometimes effects of rising house prices; sometimes both. If, somehow, despite these other causes, housing prices had not boomed, had not later experienced the inevitable post-boom bust, then the crisis would not have occurred.
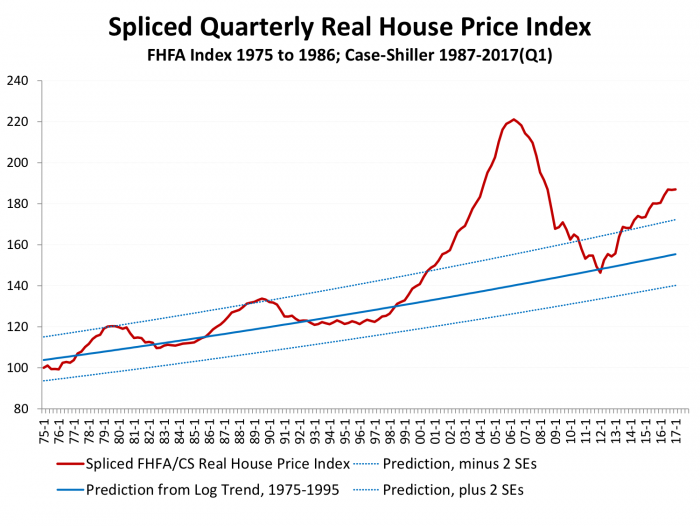
Exhibit 2
Exhibit 2 shows average real U.S. house prices over the past 40 years (as far back as reasonably reliable data permit). The data splice the best recent national price indexes, from Corelogic Case-Shiller, with earlier data from the Federal Housing Finance Agency; the index is based Q1 1975=100, and are deflated using the GDP deflator. The solid blue line is the trend during this period, extended out of sample; the dotted lines show the trend plus and minus two standard errors. Exhibit 2 is purely descriptive; we will have more to say about more sophisticated modeling of house prices in a future post. But the picture is sufficient to set the stage for today’s discussion.
From 1975 to 1995, average U.S. prices grew at about 0.4 percent per annum (inflation adjusted). During the boom, 1996 through 2006, real prices grew by about 7 percent per annum. But “every housing boom is followed by something else that starts with the letter ‘B,’” as long run analyses have repeatedly demonstrated (Ambrose et al. 2013; Malpezzi and Maclennan 2001; Shiller 2015).
After the 2006 bust, the U.S. housing market bottomed in 2012. Since then average housing prices have shown a strong recovery, and have now once more broken the two standard error barrier that preceded modest downturns circa 1979 and 1990. The annual real growth rate over this 3 year period is back up to 6 percent. While clearly less of a boom than we experienced in the early 2000s – 3 years of 6 percent growth is very different from a decade of 7 percent growth – a number of housing market observers have begun to discuss the possibility of a new “bubble” (Kusisto 2015; La Monica 2015; Vasel 2015).
Two Key Interest Rates
Our next indicators are two important interest rates. It would be difficult to find any real estate economist, or practitioner, who would argue that interest rates don’t have a profound effect on real estate markets. As research such as that by Goodman (1995), Pozdena (1990) and Schwab (1983) shows, it would be even more difficult to find a real estate economist or practitioner who could reliably specify what, exactly, that relationship is.
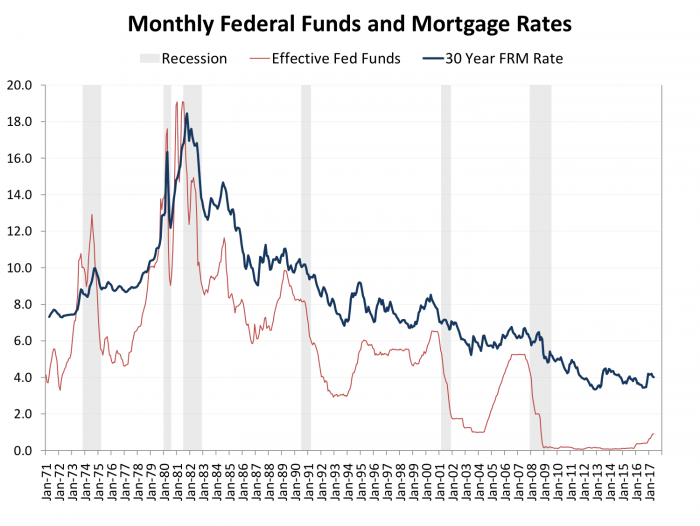
Exhibit 3
First, to the rates themselves. Exhibit 3 shows the rough correlation between the Fed’s short-term policy rate, and long-term (30 year fixed rate) mortgage rates. In the inflationary 70s and early 80s, both rose rapidly, especially after Paul Volcker became Fed Chair in 1979 and tightened Fed policy to break inflationary expectations. Both rates declined thereafter, with a few pops up occasionally in the mid-90s, and just before the Tech Bubble burst a decade and a half ago.
When that bubble burst, the Fed became concerned about a weakening economy; their response was the (in)famous “Greenspan Put” circa 2001, that dropped the Fed Funds rate from 6 to below 2 in a matter of months; the corresponding fall in mortgage rates was roughly from 8 to 6 percent. After 2004 the Fed began to pull up its policy rate, because of concerns about heading off incipient inflation, raising from 1 percent to a little over five in two years; but this time mortgage rates hardly budged. When the Great Recession started, the Fed fought back with a plunge in their eponymous Funds rate from a little under 6 to zero in short order. Mortgage rates fell as the recession hit; and broadly continued to fall slowly to accompany our long but anemic recovery.
Stepping back from cyclical stories, in many ways the big story is the long run trend down in nominal mortgage rates since those 1980 peaks. That’s in no small part to the decline in inflation, and (not quite the same thing) declines in expectations about future inflation.
In December 2015 the Fed increased its policy rate for the first time since onset of the Great Recession, by 25 basis points; it was another year until the Fed felt the economy was strong enough to handle two more 25 bps increases (December 2016 and March 2017). Now, as Dr. Coronado discussed in last week’s blog post, we’re waiting on a possible 25 bps coming this month; we’ll see whether the economy is strong enough that we’ll see follow-up increases of several percentage points, as we did circa 2005.
Exhibit 3 suggests that if the pattern of the past 30 years is any guide, we can expect increases in the Federal Funds rate to be accompanied by increases in mortgage rates – but, as long as inflation remains under control, the sort of sharp increase in mortgage rates that we saw in the 1980s are unlikely.
Nevertheless, as of this writing, somewhat higher mortgage rates are probably in the offing; conventional wisdom has it that higher rates will translate into lower prices. What does the data tell us about past such experiences? To answer that, we’ll need to look at real (inflation adjusted) interest rates and housing prices. Before we do that, we’ll need one more quick detour, to discuss how we measure expected inflation.
A Brief Look at Inflation
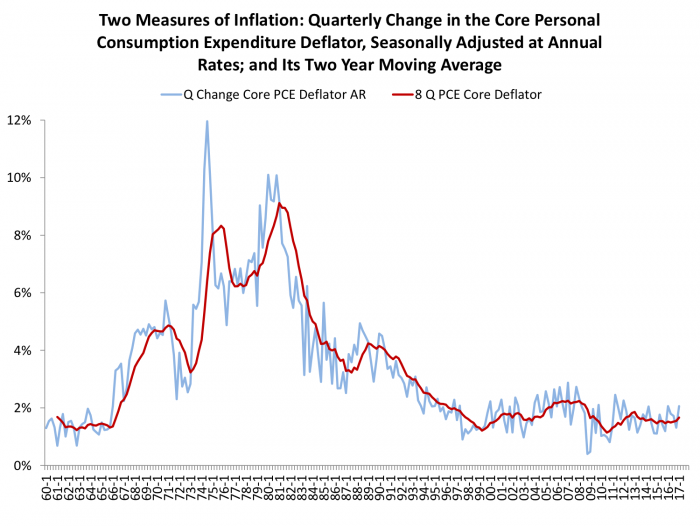
Exhibit 4
The Consumer Price Index (CPI) is the measure of inflation most familiar to the general public. To deflate mortgage rates, we’ll use a different index, the Personal Consumption Ependiture Deflator. The PCE deflator is the largest component of the GDP Deflator, since consumption is about 70 percent of GDP.
The PCE deflator has a lot more visibility since the Fed adopted a “core” version of it as their favorite inflation indicator for tracking the effects of monetary policy. Core PCE, like Core CPI, strips out volatile food and gasoline prices. Why focus on this so-called core inflation? Because food and energy are the most volatile components of consumption price indexes; and this volatility tends to cancel out over time. Large increases in food or fuel prices in a few periods are usually followed by big decreases in later periods.
It also turns out that this smoother core index is a better predictor of future inflation, which is what the Fed is worried about. And we want “smooth.” You don’t want Fed policy bouncing around every time oil or corn prices move one way or another.
Despite stripping out food and fuel, there’s still some volatility in the index. So Exhibit 4 presents both the quarterly core PCE deflator, as well as a further smoothed two year (8 quarter) moving average of this key index.
It turns out this moving average representation is useful for another purpose. Consider that if someone takes out (or funds) a fixed rate mortgage today, they’re in part making a bet about future inflation. How can we model such future inflation? While there are a number of methods, it turns out a moving average is a reasonable way to model expected future inflation, a method labelled “adaptive expectations” in the literature.
Mortgage Rates and Housing Prices
Now, armed with housing prices, interest rates, and measures of inflation, we can get to the first central issue of the post. Do housing prices move in opposition to mortgage rates, as folk wisdom has it?
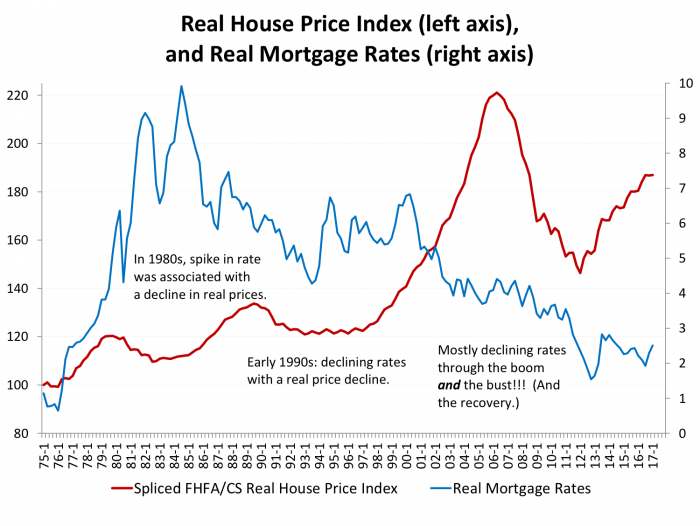
Exhibit 5
Exhibit 5 shows that reality is not so simple. In the 1980s, the spike in mortgage rates was associated with a decline in inflation-adjusted prices. But in the early part of the next decade, prices declined even as rates fell. Perhaps most inexplicably, from the simple view, mortgage rates mostly declined through both the boom of the early 2000s, and the post 2006 bust. And, for that matter, the post-2012 climb back.
Housing Prices and Capital Flows
Anyone involved in real estate over the past decade knows the real story: “mortgages are cheap, if you can get one.” Rates are low, but qualifying for a mortgage has become more difficult. It’s not just mortgage rates, loosely the “price” of taking out a loan, but also capital flows – the “quantity” of loans on offer, along with the associated rules of the game for qualifying.
Exhibit 6 revisits Exhibit 5, but now compares house prices to the flow of mortgage lending, instead of rates. House prices and capital measures are more closely connected. In particular, house prices plummeted, and flows of funds into mortgages fell off a cliff, at about the same time in 2006. A turnaround of both took hold about 3 years ago, although net growth in mortgages is just creeping back to the levels we saw in the pre-boom 90s.
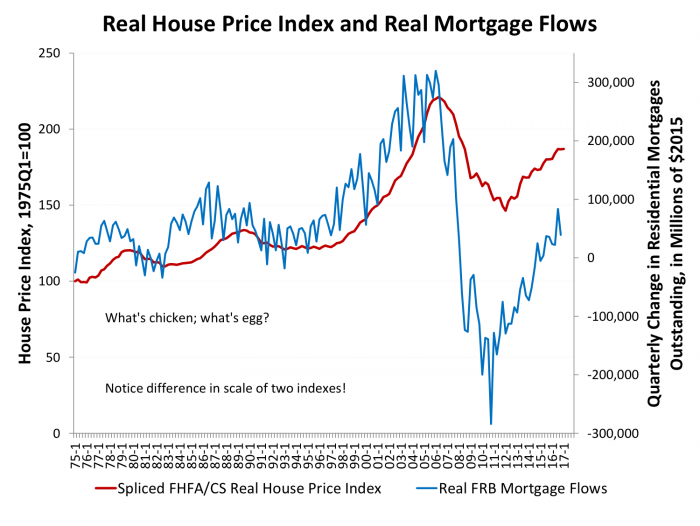
Exhibit 6
Of course, this relationship between mortgage flows and housing prices brings up the mother of all “endogeneity problems.” What’s the chicken, and what’s the egg, in this relationship? Causality goes both ways; more capital strengthens housing and real estate markets, and stronger housing and real estate markets attracts more capital. The relative strength of these effects, and their feedback loops, are not yet well specified by rigorous research.
To clarify, Exhibits 5 and 6 are not the basis of a claim that interest rates don’t matter. But the relationship between interest rates and house prices is not a simple one, and other financial condition measures matter too, sometimes more.
Want More Charts? Plenty More Where These Came From!
In addition to housing prices, we’ve examined the relationship between housing starts and our two financial measures (rates and flows). The charts are available on request. Broadly, we get similar results. Interest rates sometimes work as advertised (higher rates choking off starts, lower rates jump starting construction) but not always. Mortgage flows are better apparent predictors of housing starts, but with the extremely important caveat that we can’t ascribe causality with such simple plots.
We’ve focused on housing, but papers like Duca and Ling apply broadly similar approaches to commercial real estate. And, in addition to better untangling what’s the chicken and what’s the egg in financial markets and housing markets, we’re in the process of studying these relationships at the metropolitan level. Stay tuned for future posts!
References and Further Reading
Ambrose, Brent W, Piet Eichholtz, and Thies Lindenthal. “House Prices and Fundamentals: 355 Years of Evidence.” Journal of Money, Credit and Banking 45, no. 2-3 (2013): 477-91.
Bernanke, Ben. “Monetary Policy and the Housing Bubble. Speech at the Annual Meeting of the American Economic Association, Atlanta, Georgia. 3 January.” 2010.
Bernanke, Ben S, and Mark Gertler. “Inside the Black Box: The Credit Channel of Monetary Policy Transmission.” The Journal of Economic Perspectives 9, no. 4 (1995): 27-48.
Borio, Claudio, and Patrick McGuire. “Twin Peaks in Equity and Housing Prices?” BIS Quarterly Review 7, (2004): 79–96.
Campbell, Sean D, Morris A Davis, Joshua Gallin, and Robert F Martin. “What Moves Housing Markets: A Variance Decomposition of the Rent–Price Ratio.” Journal of Urban Economics 66, no. 2 (2009): 90-102.
Coleman, Major D, Michael LaCour-Little, and Kerry D Vandell. “Subprime Lending and the Housing Bubble: Tail Wags Dog?” Journal of Housing Economics 17, no. 4 (2008): 272-290.
Corbae, Dean, and Erwan Quintin. “Leverage and the Foreclosure Crisis.” Journal of Political Economy 123, no. 1 (2015): 1-65.
Davis, Morris A, and Stijn Van Nieuwerburgh. “Housing, Finance, and the Macroeconomy.” In Handbook of Regional and Urban Economics, edited by Gilles Duranton, J Vernon Henderson and William C Strange, 5, 753-811: Elsevier, 2015.
Davis, Morris A. and Michael G. Palumbo. “A Primer on the Economics and Time Series Econometrics of Wealth Effects.” Washington, D.C.: Board of Governors of the Federal Reserve System, 2001.
Duca, John V, and David C Ling. “The Other (Commercial) Real Estate Boom and Bust: The Effects of Risk Premia and Regulatory Capital Arbitrage.” Available at SSRN 2663194, (2015).
Favilukis, Jack, David Kohn, Sydney C Ludvigson, and Stijn Van Nieuwerburgh. “International Capital Flows and House Prices: Theory and Evidence.” In Housing and the Financial Crisis, 235-299: University of Chicago Press, 2012.
Figlewski, Stephen, and Paul Wachtel. “The Formation of Inflationary Expectations.” The Review of Economics and Statistics, (1981): 1-10.
Glaeser, Edward L, Joshua D Gottlieb, and Joseph Gyourko. “Can Cheap Credit Explain the Housing Boom?” In Housing and the Financial Crisis, edited by L Glaeser Edward and Todd Sinai: University of Chicago Press, 2013.
Goodhart, Charles, and Boris Hofmann. “House Prices, Money, Credit, and the Macroeconomy.” Oxford Review of Economic Policy 24, no. 1 (2008): 180-205.
Goodman Jr, John L. “Interest Rates and Housing Demand, 1933-1995: Common Sense Versus Econometrics.” Paper presented to the American Real Estate and Urban Economics Association, Washington D.C., 1995.
Green, Richard K. “Follow the Leader: How Changes in Residential and Non-Residential Investment Predict Changes in GDP.” Real Estate Economics 25, no. 2 (1997).
Kusisto, Laura. “Housing Bubble? Despite Rising Prices, Most Economists Still Say No.” Wall Street Journal, May 26, 2015 2015.
La Monica, Paul R. “Warning Signs in the Housing Market.” CNN Money, March 25, 2015 2015.
Laibson, David, and Johanna Mollerstrom. “Capital Flows, Consumption Booms and Asset Bubbles: A Behavioural Alternative to the Savings Glut Hypothesis.” The Economic Journal 120, no. 544 (2010): 354-374.
Leamer, Edward E. “Housing Is the Business Cycle.” In Proceedings of the Economic Policy Symposium. Jackson Hole, WY: Federal Reserve Bank of Kansas City, 2007.
Leung, Charles Ka Yui. “Macroeconomics and Housing: A Review of the Literature.” Journal of Housing Economics 13, no. 4 (2004): 249-267.
Liang, Yongping and Stephen Malpezzi. “Recent Price and Quantity Volatility in Metropolitan Housing Markets: A First Look.” In James A. Graaskamp Center for Real Estate Working Paper. Madison, WI: University of Wisconsin, 2017.
Malpezzi, Stephen. “Residential Real Estate in the U.S. Financial Crisis, the Great Recession, and Their Aftermath.” Taiwan Economic Review 45, no. 1 (2017): 5-56.
Mankiw, N Gregory, Ricardo Reis, and Justin Wolfers. “Disagreement About Inflation Expectations.” NBER macroeconomics annual 18, (2003): 209-248.
Mian, Atif, and Amir Sufi. “The Consequences of Mortgage Credit Expansion: Evidence from the Us Mortgage Default Crisis*.” The Quarterly Journal of Economics 124, no. 4 (2009): 1449-1496.
Miller, NG, MA Sklarz, and TG Thibodeau. “The Impact of Interest Rates and Employment on Nominal Housing Prices.” International Real Estate Review 8, no. 1 (2005): 27-43.
Parkin, Michael. “Adaptive Expectations.” The New Palgrave Dictionary of Economics, (2017): 1-3.
Poterba, James M. “Tax Subsidies to Owner-Occupied Housing: An Asset-Market Approach.” Quarterly Journal of Economics 99, no. 4 (1984): 729-752.
Pozdena, Randall. “Do Interest Rates Still Affect Housing?” Federal Reserve Bank of San Francisco Economic Review, (1990): 3-14.
Rajan, Raghuram G. Fault Lines: How Hidden Fractures Still Threaten the World Economy: Princeton University Press, 2010.
Reichert, AK. “The Impact of Interest Rates, Income, and Employment Upon Regional Housing Prices.” The Journal of Real Estate Finance and Economics 3, no. 4 (1990): 373-391.
Sá, Filipa, Pascal Towbin, and Tomasz Wieladek. “Low Interest Rates and Housing Booms: The Role of Capital Inflows, Monetary Policy and Financial Innovation.” (2011).
Schwab, Robert M. “Real and Nominal Interest Rates and the Demand for Housing.” Journal of Urban Economics 13, no. 2 (1983): 181-195.
Shiller, Robert J. Irrational Exuberance. Third ed.: Princeton University Press, 2015.
Van Horne, James C. Financial Market Rates and Flows: Prentice Hall, 1994.
Vasel, Kathryn. “Is It Time to Worry About Another Housing Bubble?” CNN Money, May 4, 2015 2015.