Second to a humanitarian crisis, hurricanes are a balance-sheet shock
As we assess the aftermath of Hurricanes Harvey and Irma, the main economic and political question revolves around who will bear the burden of these losses. Hurricanes are first and foremost a balance sheet shock. There will be sizable property losses for households, businesses, and public infrastructure. Using past hurricanes and current political discussions as a guide, we estimate that the federal government is likely to bear the greatest share of an estimated $120bn to $340 billion in total losses from the two hurricanes through the issuance of debt financed aid. The remainder of the losses will either be funded by private insurance or borne by the property owners themselves. While hurricanes imply sizable losses, they have a much more muted impact on GDP growth. The hurricanes may subtract 0.5pp from Q3 annualized GDP growth through some lost consumption and disruptions in activity. Jobs figures for September should be around zero or may even show a decline in employment. However, employment will likely recover before year end while reconstruction efforts will boost growth modestly and gradually throughout 2018. Overall the hurricane impact on GDP growth will likely be overshadowed by the larger trend and cyclical forces.
Property Loss and Federal Debt
Most estimates of the cost of a hurricane refer to the direct cost of the destruction of commercial, residential, personal (vehicles) and public property. Destruction of property is considered in the National Accounts to be a capital loss and does not show up in figures for GDP growth. However, the investment to replace lost and destroyed property will count as new growth over time. The main economic question is who bears the burden of the capital losses, the property owners, private insurance companies or the government.
A rough first estimate is that we will end up with something in the neighborhood of $100bn in federal aid as a result of Hurricanes Harvey and Irma, assistance that would boost the federal deficit by roughly 0.5% of GDP. The disbursement of these funds and the issuance of debt will happen over the fiscal year as programs are put in place. Some funds will be disbursed directly to individuals or businesses, others will go to state and local governments and will be disbursed over time as criteria for covering uninsured losses are developed and implemented. It is safe to assume all the aid will be deficit financed. Under current law the CBO projects that the federal deficit will narrow from $693bn, or 3.6% of GDP in fiscal year 2017 to $563bn, or 2.8% of GDP in fiscal year 2018. The prospect therefore is that the federal deficit is less likely to decline in fiscal year 2018, and may increase if tax cuts or other infrastructure or military programs are enacted.
Figure 1
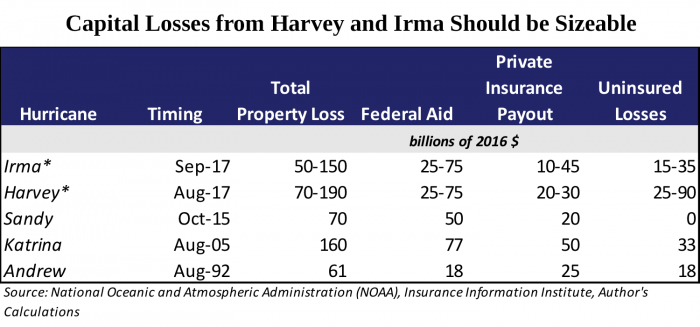
Estimates of the total and potential allocation of property losses from Hurricanes Harvey and Irma are detailed in Figure 1. All figures in the table are in in billions of 2016 dollars. Estimates of total losses from prior Hurricanes came from NOAA and estimates of private insurance losses came from the Insurance Information Institute. The table breaks the total losses estimated by the NOAA into those covered by federal aid through various programs, those covered by private insurance, and what’s left is grouped into a general category of uninsured losses. Even after government aid and private insurance payouts, households and businesses are often left with considerable losses. This matters for sorting through the likely growth impact; if households need to fund the repairs on their homes out of their own pockets, for example, they will need to tighten their belts on other types of spending. Uninsured losses are expected to be substantial with Harvey given low rates of insurance coverage. This contrasts with Hurricane Sandy where coverage rates were high and government support relatively generous.
There are a wide range of preliminary estimates of losses from Hurricane Harvey that collectively suggest they will be close to on par with Hurricane Katrina. Like Katrina, losses from Harvey will have a low coverage rate from private insurance given that 90% are due to flooding in areas private insurers won’t cover. Coverage rates even by federal flood insurance in the Houston area are only around 20% leading us to expect that the initial $7.85bn in federal aid agreed to last week will be a down payment toward a package that will grow to roughly $50bn for Harvey relief alone given the magnitude of the losses. Estimates of the impact from Irma are obviously even more preliminary and we are guessing the storm will impact Florida along the lines of somewhat more than Hurricane Andrew in 1992, the last time a category 5 Hurricane hit Florida. We think the damage may be somewhat greater given the population of Florida is larger and more dense than it was in 1992. Congress will be challenged to treat the two regions with an even hand, and we think the resulting horse race could overwhelm fiscal hawks and produce fairly generous aid packages.
Hurricanes and Growth
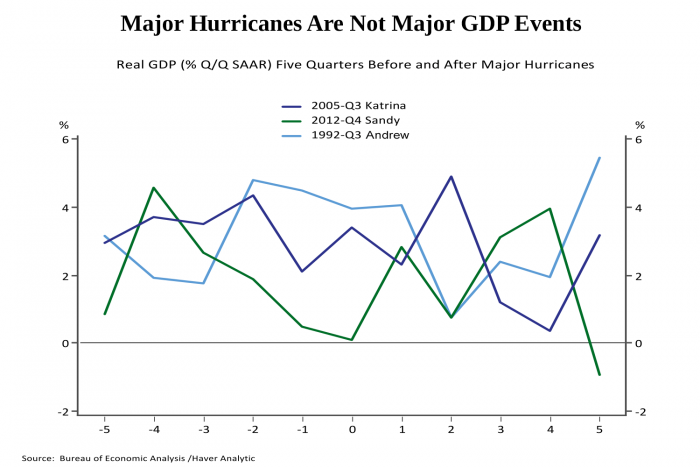
The indirect effects of a hurricane are wide ranging including temporary disruptions in economic activity and employment, a transitory hit to the broader population from higher energy prices, the subsequent boost to activity from rebuilding, a higher rate of health problems for some time after the storm, permanent loss of population, and changes in building codes and regulations. I will speak briefly to the likely impacts on employment, consumption, and construction. There is likely to be a near-term dip and rebound in employment. Meanwhile, the overall impact on GDP growth is likely to be less noticeable. Figure 2 shows the quarterly annualized growth rate of real GDP growth five quarters before and after Hurricanes Andrew, Katrina and Sandy and there is no discernible impact on growth at the aggregate level. Even though Sandy was estimated to be the smallest of the storms in total and uninsured losses it seems to have had the most noticeable impact on growth with a dip in the quarter of the Hurricane and a subsequent sustained rebound perhaps reflecting it hit the densely populated Eastern Seaboard therefore producing the largest disruptions in activity.
Figure 2
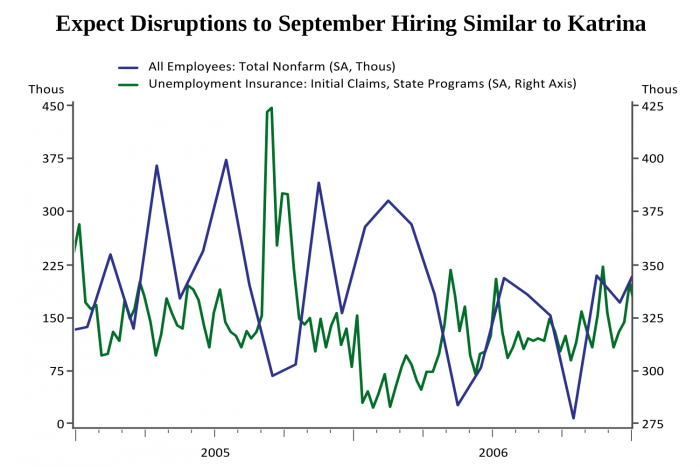
Employment: The combined impact of Hurricanes Harvey and Irma could lead to a decline in September employment as compared to an average monthly gain of 175k over the past year. We have already seen a jump of 62,000 in new claims for unemployment insurance for the week ending September 2 and that may continue to rise since the disruption in Houston is still severe and many affected people probably hadn’t made it to the unemployment insurance office during that reporting period. Hurricane Irma will also subtract from the September employment report. Houston is the fifth largest metropolitan area in the United States with 6.8mn people in 2016, while Miami ranked eighth with 6.1mn. A decent first guess is that Irma and Harvey may have similar impacts on employment resulting in a double whammy that could reduce national hiring to zero. However as Figure 2 illustrates, job losses resulting from hurricanes are generally made up in the following two to three months as the affected regions resume more normal activity and turn their attention to rebuilding.
Figure 3
Consumer Spending: The disruption that occurs when a Hurricane hits tends to take a bite out of consumer spending that isn’t made up in subsequent months. The composition of consumer spending shifts around a storm from its usual mix to bottled water and batteries, but using detailed transaction level data around Hurricane Matthew led researchers at the Federal Reserve Board to conclude that some of the lost spending on restaurants and movies and other retail items that doesn’t occur during and after a Hurricane is simply lost. The Gulf Coast region in Texas and the state of Florida together account for 8% of GDP. If retail spending is depressed in the Hurricane affected areas by 5% for a week in September as a result of the storms, Q3 GDP could be reduced by as much as 0.5pp at an annualized rate. For comparison GDP averaged 2.2% in the first half of the year so the impact would be noticeable but not devastating.
Beyond the current quarter consumption will be boosted in Hurricane areas by replacement spending for clothing and household items that will be offset in the near term to some extent by the hit to purchasing power for all consumers from higher gasoline prices. Since consumers know the spike in gas prices is likely to be transitory they will likely be more inclined to smooth through it, while the degree of replacement demand for consumer goods is likely to be dampened to the degree there are uninsured losses to property that will need to be financed. Our preliminary assumption is that a modest amount of consumption will be lost in Q3 and the impact on consumer spending thereafter will be modest overall.
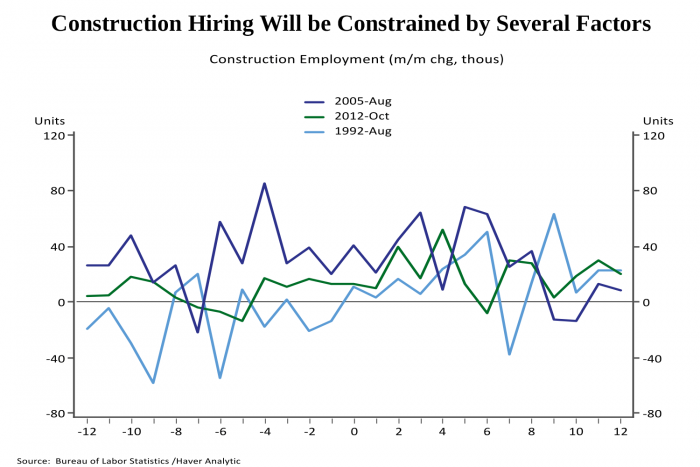
Construction: Reconstruction of lost property will boost GDP growth in coming quarters, however the cycle graphs below highlight the difficulty at the aggregate level to distinguish any impact from major hurricanes from the other trend and cyclical dynamics. The charts highlight growth of private investment in structures, residential investment, investment by state and local governments and construction employment in the months and quarters before and after the three major hurricanes we focus on in this blog. The strongest pattern is in structures (Figure 4), or commercial investment, where there is a clear drag in the quarter of the hurricane reflecting a standstill in activity in the affected region and then a boost two to three quarters later. There also seems to be a concurrent drag and boost after three quarters in state and local investment (Figure 6); these two sectors have small weights in GDP, 3% and 1.8%, respectively. Figure 5 shows there is surprisingly little evidence of any aggregate impact in the larger sector of residential investment. The impact of all sectors of construction will be evidenced in the employment data. Figure 7 suggests some upshift in construction hiring in the neighborhood of 10k-20k in the months following major hurricanes. The employment patterns from prior hurricanes suggest construction activity overall will get a boost from reconstruction in coming months. In the current environment, the impact will be dampened and spread out due to the fact that the labor market for construction workers in particular was already quite tight before the hurricanes hit with contractors reporting difficulty finding the workers they need. The current environment of restrictive immigration policies will also put a brake on the ability of employers to source workers, and the high proportion of uninsured losses which will likely push some amount of reconstruction into the do it yourself category.
Figure 4
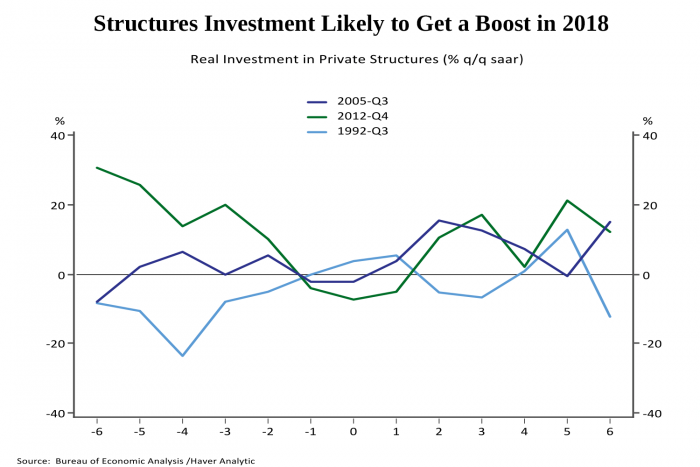
Figure 5
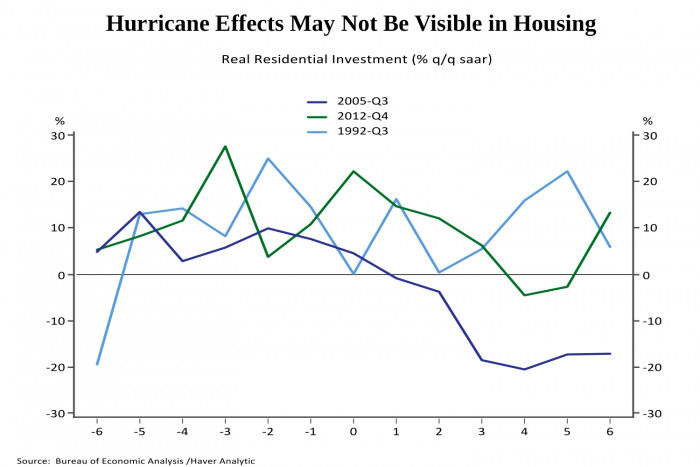
Figure 6
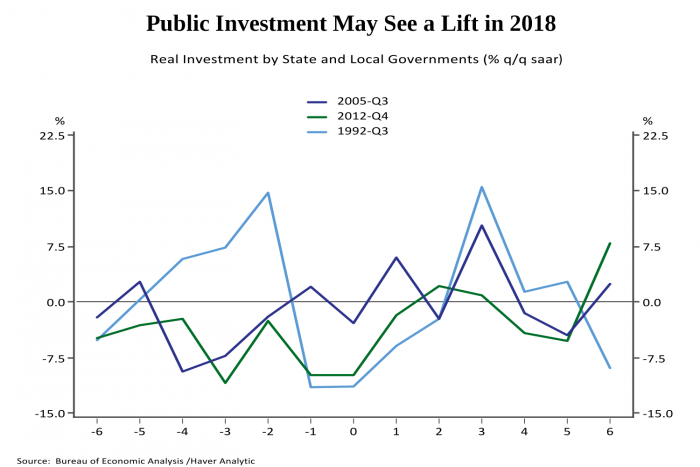
Figure 7
Just because hurricanes Harvey and Irma are likely to boost GDP growth to some extent in coming quarter certainly doesn’t mean people in these regions will become better off overall. They have experienced large hits to their net worth through the vast destruction of property, some significant part of which is likely to be uninsured. While we feel reassured by acts of bravery, generosity and kindness we see take place through the course of these storms, many people will be feeling the effects for a long time.