Why the NY-NJ metropolitan area fears curbs on immigration and international visitors
Executive summary: Nowhere is the economic threat of restrictions on immigration and the international flow of visitors and workers felt more acutely than in the New York metropolitan area. The wave of immigration to the US in recent decades was disproportionately large in NYC and arguably helped pull the city out of the economic malaise of the 1970s which brought the city to the brink of bankruptcy. Today city planners look to immigration to help offset the budgetary pressures of an aging population and a robust flow of international tourists and students are essential to the city’s economic prosperity. It is not surprising that the region’s elected officials have been some of the most vocal opponents to proposed restrictions.
In a recent blog I discussed how immigration and immigration policy are macroeconomic issues. I made the case that immigration was key to securing future US growth prospects both because population growth is projected to be driven primarily by immigration in coming years and because immigrants are thought to have a positive impact on innovation and therefore productivity growth. Policies that affect the flow of non-immigrant visitors, including tourists, international students, and workers on temporary visas can also have significant impacts, particularly in certain industries and regions.
From Stagnation to Growth
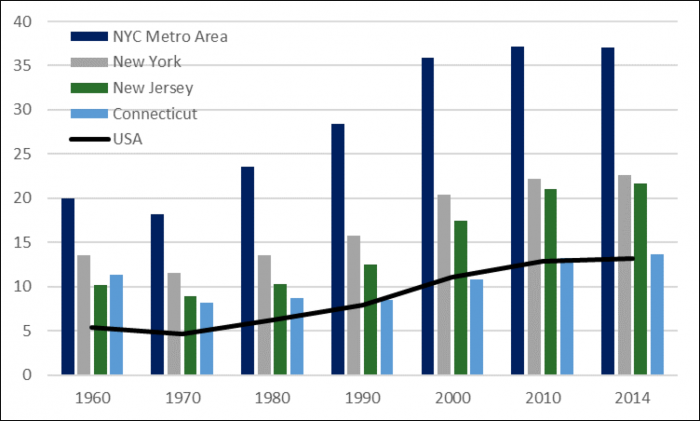
Nowhere is the significant impact of immigration and international integration more on display than in the New York City metropolitan area. The wave of immigration in recent decades helped turn around a city grappling with demographic and economic demise. Between 1970 and 2000 the share of foreign born residents in the area’s population doubled from 18% to 36% and has held roughly steady since (see Chart 1). New York ranks third amongst major metropolitan areas with the largest immigrant share of its population behind Miami and Los Angeles. New York and New Jersey are ranked second and third among states in immigrant population share behind only California.
The city has absorbed more than 1.5mn immigrants in recent decades, and at 3mn the current immigrant population in the New York metropolitan area would comprise the third largest city in the US. The composition of the area’s immigrants is somewhat different than the national profile. People from the Dominican Republic are the largest group accounting for more than 12% of the immigrant population followed by China (11%) and Mexico (6%). New York is also home to a large population from a variety of other Caribbean countries. The NYC metropolitan population as a whole has no dominant race/ethnicity or nationality group.
Chart 1 – Foreign Born Population as % of Total
Since the surge in immigration occurred two decades ago, a majority of the city’s immigrants are now naturalized citizens and the city estimates that roughly 60% of the area’s population are either immigrants or the children of immigrants.[1] New York City’s Department of Planning carefully tracks and analyzes the immigrant population as they have a different profile in terms of demands for city services for housing, health, transportation, and education. Despite the challenges of taking in a diverse population, half of whom speak only limited English, the city describes its immigrant population as having played a revitalizing role in recent decades.
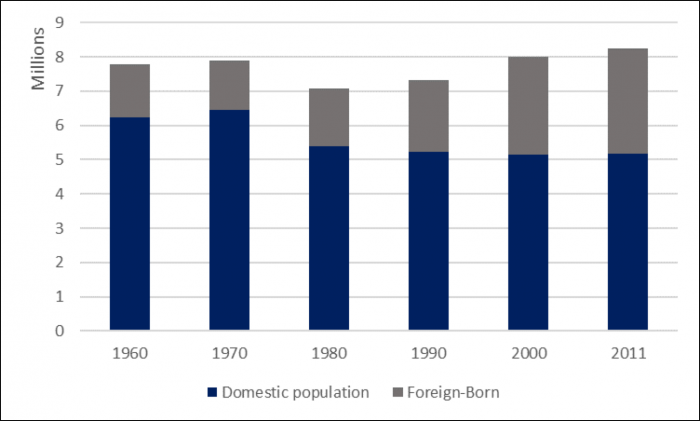
In the 1970s New York City came close to fiscal insolvency. The city had a dilapidated housing stock, high crime rates exacerbated by a lack of city police and fire protection services, and an unemployment rate that averaged several percentage points above the national average. Over the course of the decade the city saw a net outflow of residents of 1.15mn residents. The population decline would have been far more severe were it not for the arrival of 783,000 immigrants. Overall population growth, particularly for urban areas like New York, belies a sizable underlying flow of people coming and going. On net since 1970 immigrants more than account for the total population growth of the New York metropolitan area (Chart 2). That is the direct effect of their arrival and doesn’t account for the impact of the higher birth rates of the immigrant population.
When we think about economic well-being we generally think in terms of economic growth per capita, not primarily the growth driven by the fact that there are more people. However, the experience of the New York metropolitan area highlights that the size and age distribution of the population matters. Young and old populations that are not active in the workforce can imply a net demand on resources, and a declining population implies a shrinking tax base with which to finance all public services. New York City in the 1970s fell into a self-reinforcing decline of public services, quality of life and population that took the city to the brink of bankruptcy. Since immigration is such a significant share of the population, city planners crunch the numbers and are acutely aware of the stabilizing and revitalizing influence immigration had on the city’s budget and economic prospects, comparing the city favorably to most major cities in the Northeast and Midwest where populations peaked in 1950.
Chart 2 – New York City Population by Immigration Status
Immigrants to New York generally arrive during their working age years. Foreign born residents have been more likely to start new businesses and their labor force participation rate was 64.9% in 2015, as compared to 63.2% for domestic residents and 62.7% nationally. The foreign born accounted for 47 percent of the workforce of the metropolitan area as compared to 37 percent of the population. Foreign born workers comprise two-thirds of the construction workforce in the area, 60% of the Accommodation and Food Services industry and more than half of the Transportation industry. Even as the growth in immigration has stabilized in recent years, New York City planners are looking to the continued inflow and its younger age profile to help ameliorate the increasing demands of an aging population on its tax base.
A Competitive US Export
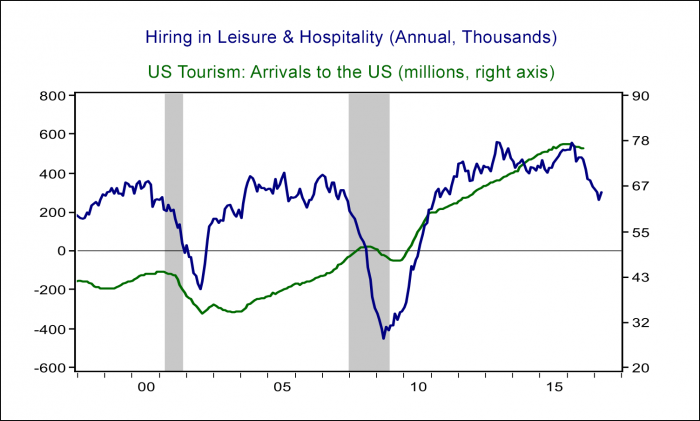
Immigration policies can also affect another source of economic vitality, the economic demand from non-immigrant international visitors to the US. While the US had a $750bn trade deficit in goods in 2016, it enjoyed a $250bn surplus in services nearly half of which was generated by tourism and education. Data from the Department of Homeland Security show that the US received 181.3mn non-immigrant international visitors in 2015, a flow of people more than half the size of the US population. These visitors include tourists and business travelers as well as longer-term visitors such as students and those on temporary work visas. The vast majority of these people were tourists or business travelers that stayed in hotels, ate in restaurants, and went home with suitcases full of retail products. Many also came to visit relatives or seek medical treatment. International tourism has grown rapidly in recent years as has hiring in the leisure and hospitality sector (Chart 3). Recent data have suggested a possible slowdown, although the drop off in overseas arrivals predates any change in immigration policy and may be related to a global economic slowdown in recent years as well as a stronger dollar. More recent data isn’t available yet.
Chart 3 – Tourism Arrivals and Hiring
Tourism is particularly important for the New York Metropolitan Area which welcomed more than 12mn international visitors in 2016 accounting for more than $8bn in revenues. The tourism sector directly and indirectly employs more than 350,000 people. Recently New York City’s tourism marketing agency, NYC & Company, lowered their projections for overseas arrivals by 300,000 in 2017 because of the Trump Administration’s travel ban on certain countries and an “unwelcoming” tone out of Washington. If realized the City’s forecast would imply the first decline in international tourism in seven years. The Fed’s April Beige Book, which compiles anecdotes about economic activity reported that in the New York region “the outlook for international visitors has weakened noticeably” noting “an increase in cancellations (conferences, meetings, school trips, etc), a drop in airline ticketing and a marked decrease in inquiries from abroad”. New York and New Jersey also welcomed 340,000 international students in 2015 and a recent survey showed 40% of colleges nationwide reporting a decline in applications.
It is too early to assess the impact of the new Administration’s policies and tone on immigration and international demand for US services. However, given the importance of immigration and international visitors to the New York economy, it is perhaps not surprising that the New York State Attorney General recently joined a lawsuit challenging the travel ban and the city has been steadfast in maintaining its status as a sanctuary city. For the region, the melting pot metaphor is not a matter of historical identity but a function of daily life.
[1] The Newest New Yorkers: Characteristics of the City’s Foreign Born Population 2013 Edition, New York City Department of Planning, December 2013.


