
Low-income housing programs that work: Part I
In several previous posts, we discussed the issue of housing affordability, as well as several policies and programs that purport to address the affordability problem. The “solutions” we examined so far – rent control and inclusionary zoning – were found wanting in several respects. There are many other housing programs and policies that we can and will examine over the months ahead in this blog, including but not limited to public housing, tax credits and deductions, interest subsidies, land use and development regulations, and today’s choice: direct cash subsidies (“vouchers”).
While some housing programs work better than others, economic analyses, both theoretical and empirical, point out serious shortcomings in many of these approaches. That doesn’t mean they are all the same. For example, we will show in a later post that the flawed Low-Income Housing Tax Credit program (LIHTC or “Section 42”) still has a number of advantages over the even more seriously flawed “classic” public housing model. And once we get started on the housing provisions of the Federal tax code you might wonder “what were we thinking?”
We will present evidence that a robust and effective housing policy revolves around a two-pronged approach. First, tackle NIMBY problems with reforms to the regulatory environment for housing and related markets. Second, where housing assistance is required for some of our citizens – the poor, the elderly, or the disabled – move from so-called supply-side subsidies in programs like public housing and the Low-Income Housing Tax Credit to more focus on the demand side and to housing allowances or vouchers. In other words, we’ll suggest moving from subsidies targeted at particular buildings to subsidies targeted at people.
Today’s first blog entry in the three-part series will examine housing assistance for those in need, particularly low income. We will focus on the Housing Choice Voucher program (HCV), a form of housing allowance: cash assistance with housing expenditures. In this first post we will study the basics of vouchers: how they’ve evolved in the U.S., how they compare to other programs, and why they are generally a better way to use valuable taxpayer dollars than subsidizing construction. A follow-on blog entry, in January, will examine additional details about vouchers, including issues related to location and mobility; and some proposals for improvement. In February we will tackle the other key set of policies in our two-pronged approach: improving the regulatory environment, striking the right balance between NIMBYism and YIMBYism.
The rest of this post proceeds as follows. First, we examine who might require assistance, particularly focusing on income. Second, we undertake a very brief review of how the federal government subsidizes low-income housing, with a focus on the evolution of Housing Choice Vouchers. Third, we examine the efficiency of vouchers, compared to other housing programs, from the perspective of an individual tenant.
Armed with these basics, we will then examine more details in a few weeks. These will include how vouchers might spill over and affect the price and quantity of housing throughout the market, comments on current administration proposals, and some suggestions for improvement.
What Do We Mean When We Say “Low-Income?”
American governments – federal, state, local – provide an array of housing assistance of various forms to households that are deemed to require assistance. The starting point for thinking about who requires assistance is income. Housing assistance is also targeted by characteristics other than income, of course. There are special programs for the elderly, for the disabled, for returning veterans, for residents of Indian reservations, for victims of natural disasters, and for the homeless, among others. But most HCVs are targeted first and foremost by income; and most of the programs aimed at special populations still have income thresholds for recipients. So we start with income.
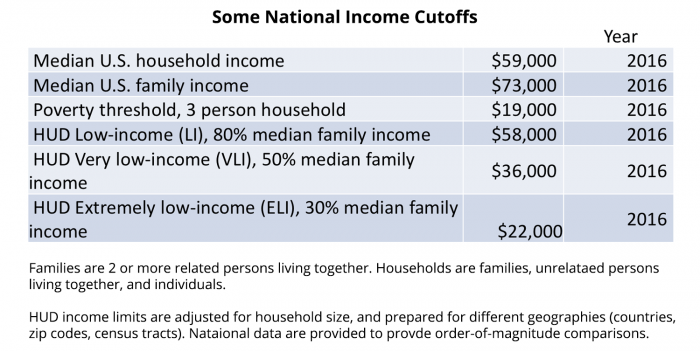
Exhibit 1 presents national summary statistics of national income data, in order to get a sense of who is targeted for housing assistance.
We often speak of targeting housing assistance to “the poor,” but official poverty measures are little used in administering federal housing programs. One reason is that U.S. poverty thresholds don’t vary by location. The poverty threshold for a three-person household, about $19,000, is the same in Newark as in Natchez, Manhattan or in Memphis, Stamford or St. Louis. Incomes and housing costs vary tremendously by city, and between cities and rural areas. So, to understand HUD’s approach to eligibility, we need to grapple with some HUD definitions and acronyms: Low Income (LI), Very Low Income (VLI), and Extremely Low Income (ELI).
HUD bases these three program thresholds on Area Median Income or AMI. These statistics are produced annually by HUD’s Division of Policy Development and Research. In contrast to poverty thresholds, which don’t vary by location, HUD analysts compute LI, VLI and ELI thresholds for a variety of geographies, notably counties, ZIP Codes and Census tracts. Poverty rates are adjusted for household size and composition, and so are HUD’s AMIs; the full databases can be found at the HUD website. The national averages in Exhibit 1 are provided to provide order-of-magnitude comparisons.
Averaging over locations and household size and composition, Low Income (LI) families with incomes near $58,000 (80 percent of area median income) could be eligible for some housing assistance. In practice HUD targets households at least below the Very Low Income (VLI) threshold of 50 percent of AMI and generally favors Extremely Low Income (ELI) households below 30 percent of AMI (about $22,000 as a rough national average). The average ELI threshold is slightly above the three-person poverty threshold of $19,000, and is about the 18th percentile of the U.S. household income distribution. As we’ll see in the next table, a large fraction of housing program assistance goes to those well below even the modest ELI threshold.
U.S. Housing Programs: Some Basics
Housing vouchers, sometimes called housing allowances, are monetary “demand side” housing subsidies, i.e. programs that subsidize a particular tenant, wherever they may live (within certain limits). This contrasts with “supply side” programs that subsidize a housing unit, i.e. a “bricks-and-mortar” program like public housing, tax credits for developers of low-income housing, etc. In the U.S. these are mostly made available to renters; although there are some examples of demand-side subsidies to owner occupiers, to date these program variants are very small; so we will focus on rental programs.
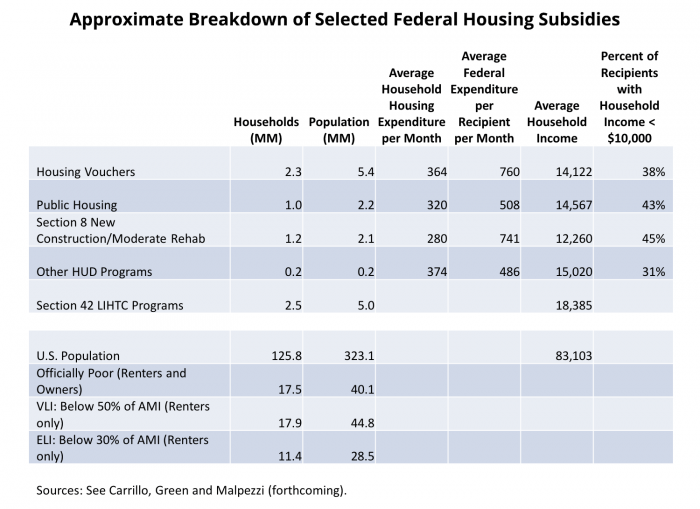
Exhibit 2 presents an approximate breakdown of households and population served by the main U.S. housing subsidy programs, and some parallel information regarding total and low-income populations for comparison. The main supply-side programs of HUD include public housing, and Section 8 New Construction/Substantial Rehabilitation, presented separately; and a catch-all category of “Other HUD Programs” that includes dozens of supply-side programs such as Section 236 and other interest rate subsidies to landlords, Section 202 subsidies to projects for elderly tenants, and Section 811 subsidies for projects for disabled persons. Most of these HUD project-based programs are now legacy programs; it’s been decades since any significant new development has taken place in many of these program categories such as public housing or Section 8 New Construction; but of course, a substantial albeit aging stock of such projects exist. The main active supply side program is the Section 42 Low Income Housing Tax Credit program. The main demand side program, Housing Choice Vouchers, is active although the number of new vouchers provided in recent years has been modest.
Exhibit 2 also presents HUD’s administrative data on the average household housing expenditure per month of households in each of the major program variants, as well as the average HUD expenditure per recipient per month. There are no such data for Low Income Housing Tax Credit projects.
On average Housing Choice Voucher recipients spend $364 per month on rent and utilities, while the taxpayer kicks in an average of $760. Both rents and HUD contributions are lower for public housing and the legacy supply side programs, although this is partly due to the age and location of the bulk of these units.
Column 6 of Exhibit 2 presents an estimate of the percentage of each program category’s recipients with household incomes under $10,000. 30 to 45 percent of households served by HUD programs are below these very extremely low cutoffs.
A complete listing of HUD housing programs including the numerous variants on Housing Choice Vouchers can be found at Programs of HUD. Discussion of some of the main program variants can be found in at Green and Malpezzi, and in Schwartz.
Many programs that provide income or services to households are entitlements; that is, if a household meets certain requirements, they are entitled to the benefit, and receive it as a matter of course. Government spending expands to fit demand and thus the size of the entitlement program. Social Security, Medicare, the mortgage interest deduction, and food stamps (SNAP) are well-known examples of entitlement programs. None of the aforementioned low-income housing programs is an entitlement. The sizes of the Housing Choice Voucher, Public Housing, Section 8, Low Income Housing Tax Credits, all of them, are limited by their appropriated budgets. Therefore roughly a third of households theoretically eligible for low-income housing assistance of some kind, supply side or demand side, receives assistance.
All in, Exhibit 2 shows that about 6.4 million, or about 5.5 percent of U.S. households receive some low-income housing subsidy. This compares to about 18 million households below the 80 percent AMI threshold, and 11.4 million below the more stringent 50 percent of AMI.
How have these programs evolved over time? Exhibits 3 and 4 provide an overview of the dynamics of these housing programs, or rather broad categories of programs. They present very similar data, but Exhibit 3 gives a better view of the relative growth of the major categories, and Exhibit 4 gives a better view of the total supply of subsidies relative to the number of households in the U.S.
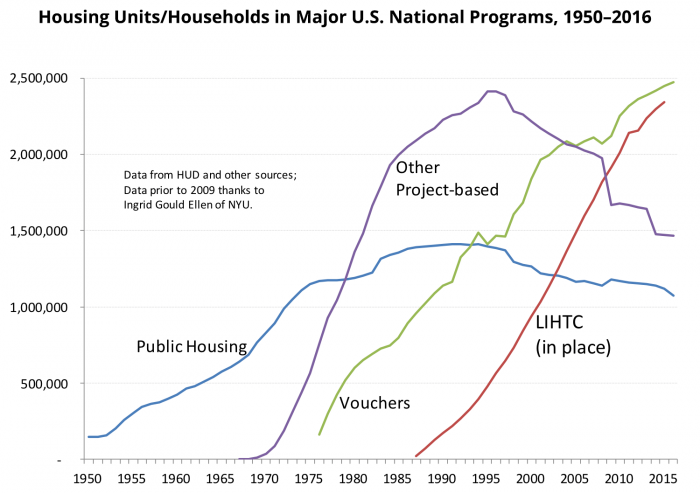
Exhibit 3 highlights the growth of public housing over the 50s and 60s, topping out at fewer than 1.5 million units in the late 1980s; it has since declined to just over a million. Other project-based programs, including but not limited to Section 8 New Construction and Substantial Rehabilitation, grew rapidly in the 1970s as traditional public housing production ground to a halt; these projects also stopped coming online in the 1990s. After the Tax Reform Act of 1986, the Section 42 Low-Income Housing Tax Credit Program began to grow rapidly, as it became the major source of new low-income supply-side subsidies. On the demand side, Section 8 Existing/Housing Choice Vouchers started in the mid-70s, as noted above; the number of vouchers on offer has reached about 2.5 million; after years of rapid growth, we may be facing a period of retrenchment, as we’ll discuss in our next post.
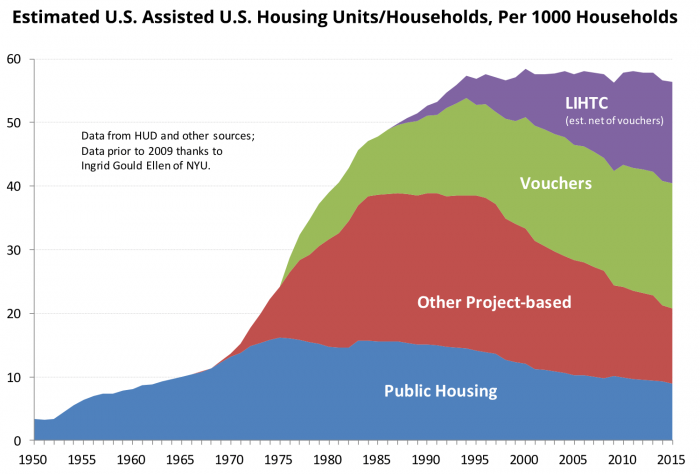
Exhibit 4 presents almost the same data as Exhibit 3, but “stacked” and normalized by the number of households in the U.S. Now we see more clearly that it was just when new public housing was grinding to a halt that the major expansion of U.S. low-income housing subsidies took place. In the aggregate, subsidies increased substantially most years through the 1980s and early 1990s, topping out by the mid-1990s. Exhibit 4 also clarifies that behind these aggregate trends, the mix of subsidies changed markedly, moving from public housing and legacy project-based programs to a mix more heavily weighted towards vouchers and the Section 42 program. Another insight from Exhibit 5 is that despite the fact that we haven’t built new public housing or Section 8 New Construction units for decades, their legacy is still with us; about 40 percent of the subsidized low-income housing in the U.S. is still delivered through these older programs.
Exhibits 3 and 4, above, count units/households subsidized. How does this translate into taxpayer expenditures? Exhibit 5 presents real annual budget outlays for HUD housing programs, along with the annual tax expenditures “spent” through the Low-Income Housing Tax Credit program. Exhibit 6 presents a much shorter timeline on real outlays for housing vouchers. (Prior to 2005, HUD and OMB did not present vouchers as separate line items in annual budget presentations).
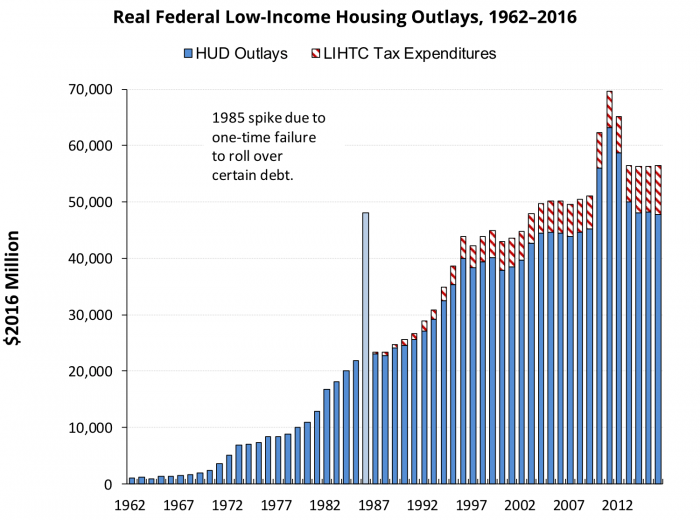
HUD outlays peaked in 2010 at over $60 billion. A series of recent cutbacks, including the so-called “sequester,” have drastically cut low-income housing assistance to well below $50 billion. The Low-Income Housing Tax Credit costs about $8 billion in foregone revenue each year, and grows more “smoothly,” partly because the credit is not affected by the sequester, partly because the LIHTC appears to have more bipartisan political support from homebuilders and other potent constituencies, and partly because a credit for a unit coming online this year is spread over 10 years.
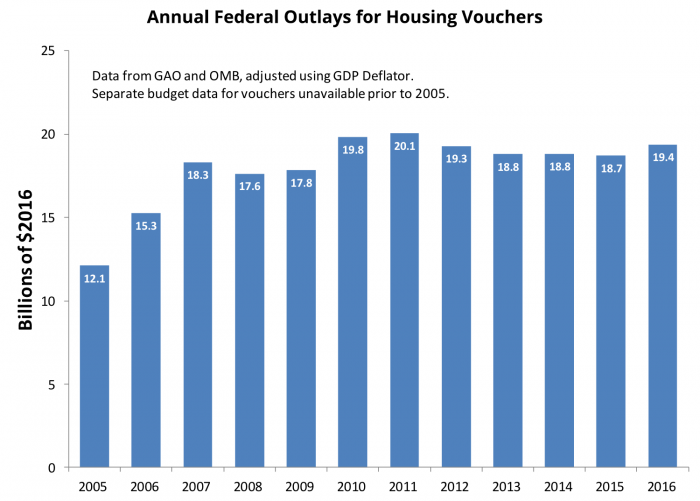
Voucher outlays peaked at about $20 billion during the post-Great Recession stimulus; after falling by over $1 billion, they’ve recovered somewhat in 2016 but it appears that more cuts may come, given the dynamics of the Federal budget process.
The voucher program has evolved substantially since it was originally introduced about 4 decades ago. Carrillo Green and Malpezzi, and Schwartz, explain some of the history; here, like Inigo Montoya, we sum up. In the 1970s, motivated by perceived problems with public housing and strong interest in housing allowances (vouchers) as an alternative, the Experimental Housing Allowance Program (EHAP) undertook a multi-city, multi-year study of variations in designs of housing vouchers. While EHAP was still underway, in 1974 the Housing and Community Development Act created Section 8 Existing Housing Certificates, the first permanent national voucher program. In 1984, the Rental Housing Voucher program was created to run in parallel with Section 8 Existing, with certain design changes. During the 1990s, Section 8 Certificates and Rental Housing Vouchers were gradually harmonized; once they settled on a set of common rules, circa 1999, they were combined into today’s Housing Choice Voucher program.
The HCV label emphasizes that voucher users can (in contrast to public housing, LIHTC, etc.) choose their units, subject to finding an agreeable landlord, and units that meet program standards. HUD’s Housing Choice Voucher Program Guidebook provides authoritative, at times mind-numbing, details.
Next, we move to a summary of the literature on the evaluation of vouchers, compared to other low-income housing programs.
Evaluation of Vouchers, and Other Housing Programs, from the Household/Micro Perspective
Evaluating housing programs requires addressing both efficiency and equity considerations. We discuss efficiency in this section, and equity in the final section of the post.
In fact, there are three concepts of efficiency which we apply to housing programs, or any in-kind transfer program. The first is called production efficiency: what does it cost for the government to produce a unit, compared to the most efficient producer? We measure this straightforwardly by comparing production costs to market value, just as a private developer would.
Second is transfer efficiency, sometimes called consumption efficiency: how does the recipient value the unit, compared to the market valuation? We measure this concept using consumer’s surplus, as detailed below.
Third is administrative efficiency: how much “teeth to tail,” i.e. how much spent on the bureaucracy? We measure this partly by how much we spend on administration as a share of program benefits.
Production efficiency. The most careful analysis of production efficiency of public rental housing – the market value of program housing, relative to its real resource cost — remains Mayo et al. (1980), summarized in Mayo (1986). Mayo (1986) reported that the production efficiency of U.S. public housing is about 50 percent (ratio of value to costs). Another study by Olsen and Barton (1983) that took a more narrow view of production efficiency reported that U.S. public housing costs 14 percent more than it was worth. Green and Malpezzi (2003) and Weicher (2012) review findings on production efficiency from a range of studies, and find similar results.
Combining data from those two reviews, we find 7 estimates of the production efficiency of public housing; these average production efficiency of 64 percent, with a median of 56 percent. Our combined studies yield 10 estimates of production efficiency from other supply-side programs such as Section 8 New Construction and Section 236. These yield an average production efficiency of 74 percent, with a median of 73 percent. The best results, unsurprisingly, are from demand-side programs such as Section 8 Existing Certificates, Housing Vouchers, and the housing allowance programs implemented in the Experimental Housing Allowance Program. Five such estimates yield an average production efficiency of 92 percent, with a median of 93 percent.
Transfer efficiency. Consumption or transfer efficiency is a little more complex than production efficiency, although conceptually it’s very intuitive. First, the intuition. When governments give recipients cash, a dollar is worth a dollar. Once received, the recipient can spend as he or she sees fit.
On the other hand, when governments give “in-kind” transfers, such as housing, or food, or medical care, the recipient would value the transfer at market prices if the good in question happens to be the same as they would consume in the absence of the program. But of course, they might, at market prices, prefer some other house, or different food, or some alternative medical care. In such a case, the benefit to the recipient is the amount they would be willing to pay for the specific good on offer from the government. To the extent they discount the value to them from market value, there is some transfer inefficiency.
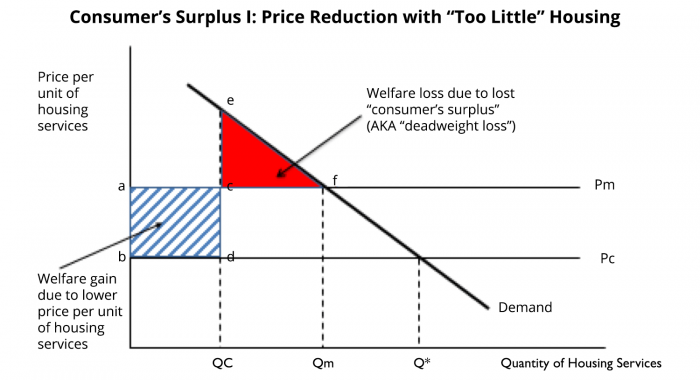
Exhibit 7 presents a stylized example. Suppose a representative target household has a demand for housing represented in the Exhibit. Let Q represent some composite quantity of housing services, where moving to the right means “more house.” (For the moment, simplify by thinking of Q as square feet, if you like.) P represents the rental price per unit of housing services, i.e. per unit of Q. Our tenant would prefer Qm at market price Pm.
Suppose the government offers a public housing unit at a deep discount, with rent per square foot about half the market price (Pc is half of Pm). At the subsidized price per unit of housing services Pc, if unconstrained our tenant would purchase even more housing (Q*). But they are not unconstrained; they are given a take-it-or-leave-it offer to consume Qc units at the subsidized price Pc.
Thus, if Qc<Qm, the tenant receives benefit (lower rent) abcd, but loses consumer surplus def. The net benefit to the tenant is the difference. In other words, as long as the rectangle in Exhibit 7 is bigger than the triangle, our tenant will prefer the subsidized unit.
Notice as Qc approaches Qm from the left, tenant benefit increases and the deadweight loss shrinks. One can also show that when Qc is larger than Qm (the government-offered unit is “too big,” there is still some deadweight loss.
All in, government spends abcd on the housing subsidy. The transfer or consumption efficiency is simply the ratio between net tenant benefit, and the cost of the transfer to the government, or (abcd – def)/abcd.
Again, the intuition is simple. Take another look at Exhibit 7: the closer Qc is to Qm, the smaller the deadweight loss triangle, and the larger the welfare gain rectangle. By the way, it turns out that there is some loss of transfer efficiency if the unit is bigger/better than the household’s ideal Q; they consume more housing but are spending more money, even at the lower price, than they would if they could get to their (in this case smaller) Qm. Green and Malpezzi present a full analysis of this alternative case.
In light of the discussion above, we would expect to find that unconstrained housing allowances would have the highest consumption or transfer efficiency, while the more directly involved the government was in the supply side, the lower the transfer efficiency. Consumption efficiency has been studied more often than production efficiency. Green and Malpezzi (2003) and Weicher (2012) reviewed empirical studies of U.S. housing programs that computed this consumption efficiency using consumer’s surplus techniques. Combining the Green and Malpezzi and the Weicher tables, we find 9 estimates of the consumption efficiency of public housing; these average production efficiency of 73 percent, with a similar median, 73 percent. Our combined studies yield 9 estimates of consumption efficiency from other supply side programs; these yield an average consumption efficiency of 72 percent, with a median of 71 percent. Once again the best results are from demand side programs such as Section 8 Existing Certificates, Housing Vouchers, and the housing allowance programs implemented in the Experimental Housing Allowance Program. Five such estimates yield an average consumption efficiency of 89 percent, with a median of 93 percent.
Administrative efficiency. Administrative efficiency is a question of how much “teeth to tail,” i.e. how much spent on the bureaucracy? We can measure this by measuring how much we spend on administration as a share of program benefits. While not negligible, these are usually treated as second-order effects in evaluation studies, and for simplicity we’ll ignore them today.
Total (microeconomic) efficiency. Since we’re assuming away administrative inefficiency today, for simplicity, the total efficiency of the program is the product of production efficiency and consumption efficiency. If we use our averages across studies, 0.63*0.73 yields a total efficiency of 47 percent for public housing; using medians yields 41 percent. The corresponding figures for other supply-side programs yield a total efficiency of 53 percent (averages; medians yield 52 percent). The demand side programs dominate, with a total efficiency of 82 percent if we use the average of available studies; and 86 percent if we use medians.
The Bottom Line
To put it in simple terms, for every taxpayer dollar spent on project-based/supply-side programs, households receive a benefit that they value at somewhere between 40 and 60 cents. For every taxpayer dollar spent on demand-side/voucher programs, households receive a benefit that they value somewhere between 80 and 90 cents. In our future post that discusses possible improvements to the voucher program, we will discuss some changes that could conceivably increase this transfer efficiency even further.
Our microeconomic analysis of a representative household and a representative housing unit assumes that market prices are given – households in the program are “price takers” as you recall from Econ 101 analysis of competitive markets. But what if the housing voucher program is “large,” specifically big enough that we need to also consider possible effects on the overall rental market? This is another one of the questions we’ll tackle in our next post on low-income housing.
References and Further Reading
Been, Vicki, and Ingrid Gould Ellen. “Rental Housing Policy in the United States.” Cityscape: A Journal of Policy Development and Research 13, no. 2 (2011).
Carlson, D., R. Haveman, T. Kaplan, B. Wolfe, C. Heinrich, J. Kling, J. Mullahy, and G. Painter. “Long-Term Effects of Public Low-Income Housing Vouchers on Labor Market Outcomes.” Institute for Research on Poverty, Discussion Paper, no. 1363-09 (2009).
Carrillo, Paul, Richard K Green, and Stephen Malpezzi. A Primer on U.S. Housing Markets and Housing Policies, Second Edition. Forthcoming.
Green, Richard K., and Stephen Malpezzi. A Primer on U.S. Housing Markets and Housing Policy. American Real Estate and Urban Economics Association Monograph Series. Washington, D.C.: Urban Institute Press, 2003.
Mayo, Stephen K. “Sources of Inefficiency in Subsidized Housing Programs: A Comparison of U.S. And German Experience.” Journal of Urban Economics 20, no. 2 (1986): 229-49.
Mayo, Stephen K., Shirley Mansfield, D. Warner, and Richard Zwetchkenbaum. Housing Allowances and Other Rental Housing Programs: A Comparison Based on the Housing Allowance Demand Experiment, Part 1: Participation, Housing Consumption, Location and Satisfaction. Cambridge, MA: Abt Associates, 1980.
———. Housing Allowances and Other Rental Housing Programs: A Comparison Based on the Housing Allowance Demand Experiment, Part 2: Costs and Efficiency. Cambridge, MA: Abt Associates, 1980.
Newman, Sandra J, and Ann Burnet Schnare. Beyond Bricks and Mortar: Reexamining the Purpose and Effects of Housing Assistance. Vol. 92: The Urban Insitute, 1992.
Olsen, Edgar O. “Getting More from Low-Income Housing Assistance.” Washington, DC: Brookings Institution, The Hamilton Project, 2008.
Olsen, Edgar O., and David M. Barton. “The Benefits and Costs of Public Housing in New York City.” Journal of Public Economics 20, no. 3 (1983): 299-332.
Quigley, John M. “Rental Housing Assistance.” Cityscape (2011): 147-58.
Sard, Barbara. “Housing Vouchers Should Be a Major Component of Future Housing Policy for the Lowest Income Families.” Cityscape 5, no. 2 (2001): 89-110.
Schwartz, Alex F. Housing Policy in the United States. Second Edition ed.: Taylor & Francis, 2010.
Struyk, Raymond J., and Marc Bendick. Housing Vouchers for the Poor: Lessons from a National Experiment. Urban Institute Press, 1981.
U.S. Congressional Budget Office. The Cost-Effectiveness of the Low-Income Housing Tax Credit Compared with Housing Vouchers. Prepared by Leonard Burman. Washington, D.C.1992.
U.S. Department of Housing and Urban Development. Programs of HUD: Major Mortgage, Grant, Assistance and Regulatory Programs 2017. Washington, DC2017.
Weicher, John C. Housing Policy at a Crossroads: The Why, How, and Who of Assistance Programs. AEI Press, 2012.