
What spending may be saying about stock market valuation
The stock market continues to dance near all-time highs producing record highs in household balance sheets. Yet growth in consumer spending remains surprisingly moderate. While most forecasters look to changes in wealth as a driver of consumer spending, other researchers have concluded that the causality may go the other way. They find that when asset valuations and consumer spending become misaligned with their longer run relationship, asset valuations tend to correct back to trend. Subdued consumption may suggest downside risks to current equity valuations of as much as 30 percent, and other valuation metrics are also looking increasingly stretched. Recently these same researchers have concluded that asset price dynamics experience medium term regimes that are surprisingly inversely related to economic fundamentals. Low trend growth may lead to high asset prices in part because the Fed must employ persistently low interest rates to offset weaker trend growth, which in turn suppresses volatility and risk premia. That doesn’t mean asset prices go up forever in such a regime. In recent decades a higher average level of household net worth has also been associated with large, cyclical swings in asset prices and consumers may be telling us we are close to a peak.
Does Wealth Predict Consumption or Vice Versa?
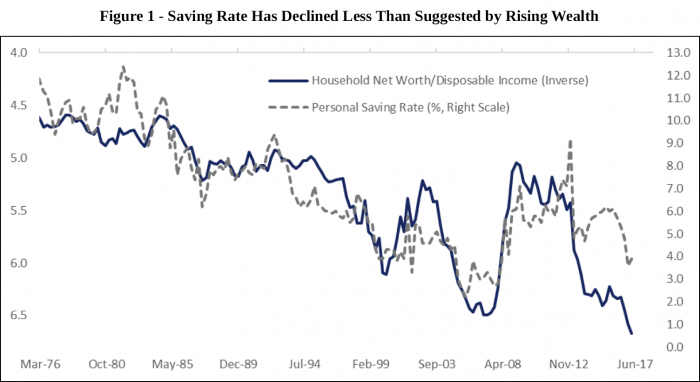
In a blog a couple of weeks ago I outlined how household net worth and the wealth effect became a central part of consumption forecasting starting in the 1990s as we entered the era of asset price booms and busts. I also outlined how the impact of wealth on consumption has been more attenuated of late. Figure 1 illustrates the attenuated wealth effect by plotting the personal saving rate against the inverse of the ratio of household net worth to disposable income. If consumers are spending based on gains in wealth instead of income the saving rate should decline as consumers effectively decide they can save less out of current income and achieve the same future wealth accumulation goals. The saving rate has indeed declined over the past two years, but notably less than suggested by past reactions to booming balance sheets.
The forecasting relationship between wealth and consumption is based on economic theory, but also the statistical finding that wealth, consumption and income share a common trend over time, confirming they are driven by similar forces. Most forecasters and researchers, including those analyzing the economic outlook at the Federal Reserve, tend to focus on changes in wealth as helping to explain and forecast consumption. However, two researchers published a series of high profile papers more than a decade ago that focused instead on what consumption may be telling us about wealth valuations.
Martin Lettau of University of California Berkeley and Sydney Ludvigson of New York University, whom I will refer to collectively as LL for simplicity, published a number of papers on the relationship between consumer spending and wealth.[1] One of their key findings was that wealth, consumption and labor income indeed share a common trend over long horizons, however wealth is more volatile over shorter horizons and displays mean-reversion over medium term horizons. If household net worth rises or falls in a way that is not mirrored in consumption, it is asset valuations that are more likely to correct back to their longer run trend, rather than consumption moving to align itself with asset values. LL concluded that “a large fraction of variation in wealth…is ultimately unsustained and unrelated to aggregate consumption”, and that “conventional estimates of the wealth effect greatly overstate the response of consumption to a change in wealth.”
Another key finding by LL was that the long run relationship between consumption and income can provide information for forecasting excess gains or losses on stocks. Since consumption is less volatile over time, if it is running persistently stronger than the path predicted by current wealth valuations, it tends to be a signal of better stock returns to come. Likewise, if consumption is running weak than it may signal a period of below trend returns are in store. The intuition is straightforward; if consumers are spending at a rate stronger than that predicted by the historical relationship with income and wealth it can be an indication that consumers are correctly anticipating better returns, or that their freer spending creates profit opportunities for companies, or both. The relationship LL found is not high frequency, rather persistent errors in the consumption model can provide relevant signals for stock valuations over the following one to five quarters.
I estimate a standard long-run model of consumption, income and wealth like that used by LL and the model described in the seminal paper by Dr. Morris Davis in Davis and Palumbo (2001) with a couple of alterations. The standard model estimates the ratio of consumption to income as a function of household net worth. Davis and Palumbo also included a variable intended to capture the impact of an aging population on consumption. I follow their approach and include transfer income, like that from social security, as a share of total income, which predicts that the saving rate will decline as the population ages and more people are in the phase of life where they are living off accumulated savings and fixed income payments. I also include a now standard approach to wealth of breaking out financial and housing wealth separately to identify the different relationships between housing, stock market wealth and consumption. Finally, I include a shift in consumer’s reaction functions following the financial crisis. In my next blog, I will detail the various reasons consumers may be saving more in the aftermath of the Great recession, but suffice to say in this blog that an upward shift of 2.5% in households’ desired saving rate starting in 2009 is highly statistically significant in a consumption model.
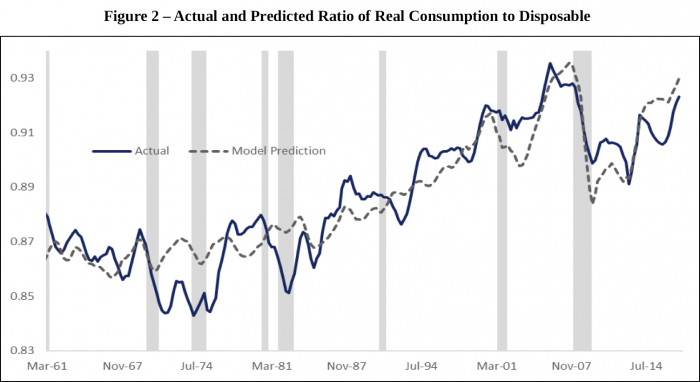
The results of the model are shown in Figure 2, which plots the ratio of actual consumption to income averaged over four quarters against the predictions of the model described above. Actual consumption is more volatile than the path predicted by the model. LL found that persistent deviations from the model contain predictive information for stock prices over a one to five quarter horizon. I follow the approach of LL and regress excess returns on the S&P 500 calculated as in LL as as the return on the S&P 500 minus a 3-month Treasury Bill rate against the errors from the consumption model and lagged excess returns to capture the momentum in markets. Like LL I find that the consumption errors are significant predictors of excess stock returns with a lag of three to four quarters. The model has an R-squared of 0.57 and a standard error of 10% so there is much it doesn’t account for. However, the coefficient is economically significant with a 1% miss on consumption in a given quarter predicting a 2% correction in the S&P 500 four quarters later.
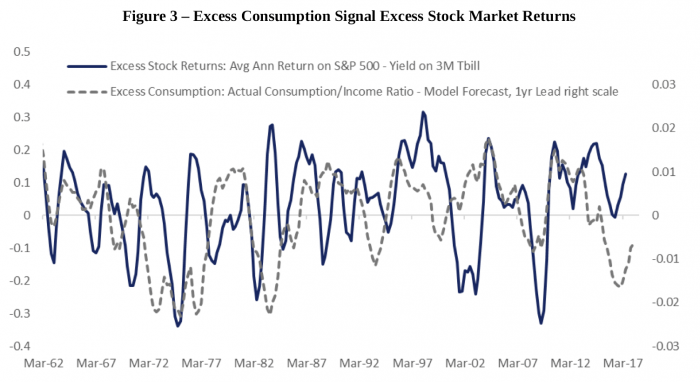
Figure 3 plots the four quarter averages of excess returns on the S&P 500 against the errors of the consumption model. The relationship is noisy and the raw correlation is just 0.17. However, the relationship shows that in the 1970s consumers persistently consumed less than the model predicted, which was indeed associated with a period of subpar returns in the stock market. In contrast consumption ran above model predictions starting in the early 1990s, which proved to be an accurate signal of strong stock returns to come. The strong consumption of the 1990s missed the magnitude of the returns, which ultimately proved unsustainable and stocks subsequently saw a period of below trend returns to bring valuations back to the longer run trend. Strong consumption in the 2000s was more related to housing valuations, however stock prices also rebounded. The error on the consumption model turned negative, signaling below trend consumption, in 2007, correctly indicating that negative returns were in store. More recently the error on the model turned negative in 2014, indicating that we should expect below trend returns on equities. That has not come to pass and the stock market has continued to generate positive excess returns. In this model of stock returns the accumulated negative misses over the past three years would call for a fairly sizeable correction in the S&P 500 of roughly 30%. This is consistent with the long-run consumption model which would also point to a roughly 30% adjustment downward in wealth to align it with the current consumption trend.
The Complex Concept of Fair Value and Implications for Monetary Policy
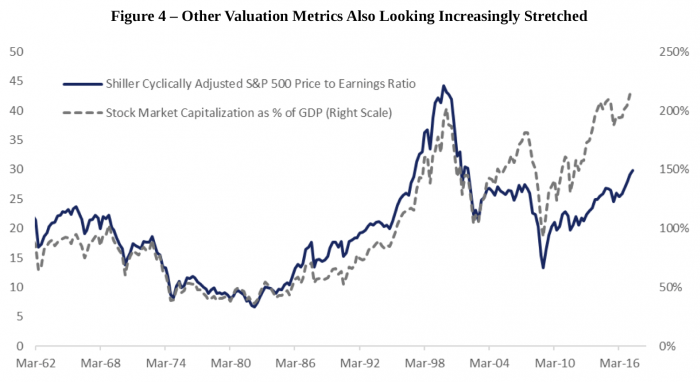
The models are hardly ironclad, there are a lot of factors driving the stock market at any given time. Indeed, the model predicts a market correction should have been underway more than a year ago. Nonetheless cautious consumer behavior isn’t the only indication equity valuations may be stretched. Figure 4 plots total stock market valuation relative to GDP which has reached an all-time high, a pattern that also holds if global GDP is used instead as the denominator. The chart also includes Robert Shiller’s cyclically adjusted S&P 500 price to earnings ratio. The latter takes into account lower long-term interest rates which imply a lower discount rate on future earnings, thereby justifying higher absolute equity valuations. The Shiller measure isn’t nearly as high as the valuation reached in the late 1990s, but it is the second highest in history.
If low interest rates are a result of low trend growth they shouldn’t necessarily justify higher asset valuations as implied by the Shiller measure. Recently LL along with a third colleague revisited the relationship between consumption and asset values in light of the persistently high asset prices of late. They conclude that there appears to be regimes in asset prices that can last for decades, and that these regimes tend to be ironically inversely related to economic fundamentals, such that low trend growth and inflation tend to be associated with persistently high prices of risky assets. This occurs because interest rates aren’t low only because of low growth and inflation, but because of compressed risk premia and volatility. This new work from LL concludes that high asset valuations must be the result of reach for yield behavior in light of aggressively accommodative monetary policy.
It is an empirical reality that we are in a period of compressed volatility and risk premia and therefore higher asset valuations in part owing to monetary policy. Faced with low trend growth and inflation the Fed has maintained low interest rates and used its balance sheet in recent years to support asset valuations. However, this policy may not be an irresponsible strategy on the Fed’s part. While market participants often shake their fists at the Fed, the FOMC is mandated to do by Congress to pursue the best possible outcomes for the economy, and their choice is to engage in these policies or accept even lower growth and inflation. Low interest rates are often blamed for hurting savers, however Figure 1 highlights that low rate policies have been associated with higher trend net worth that has in turn allowed consumers to save less and consume more. Higher rates could deflate both equity and home values and lead consumers to worse economic outcomes.
Overly easy monetary policy may have started as a policy misjudgement in the 1990s and lax regulatory oversight and complacency in in the 2000s, but it is seems to be less of an option in the aftermath of the Global Financial Crisis. This is not new or unique to the Fed; Carmen Reinhart and Ken Rogoff have outlined that financial repression is a standard and necessary response to a financial crises and balance sheet deleveraging. If the FOMC were to conclude that it was irresponsible to support the economy through high asset valuations and attempted to deflate them with tighter policy, there could very well be a public and political backlash. After all the American public elected a President whose campaign shamed people for suggesting that lower growth is structural and promised heroic policies to lift growth.
The next Fed Chair appointed by this President may very well be inclined to let asset values run further with easy policy rather than reign them in and slowing growth further. To date the current FOMC has responded to the era of high asset values by trying to limit the systemic risk from such valuations by ensuring the banking system is well capitalized and less vulnerable to runs, and that leverage isn’t the fuel behind rising asset prices. The Fed is currently attempting to fold in concerns about financial stability into decisions about the appropriate stance of monetary policy, something Janet Yellen will be speaking about at Jackson Hole. However folding asset prices and financial stability explicitly into their reaction function has been a messy business.
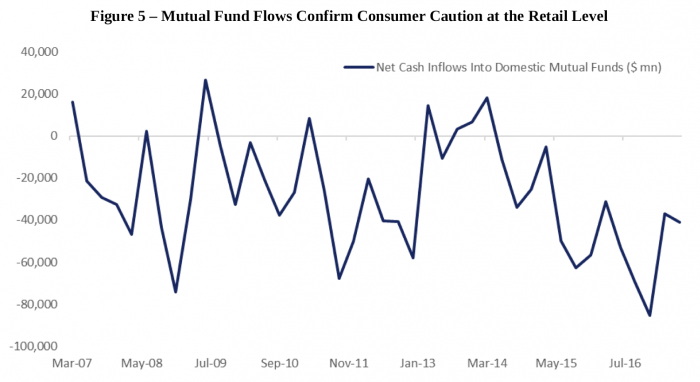
Returning to our earlier analysis, even if we are in a regime of higher asset prices, consumers are telling us that they are not buying into higher valuations as much as they did in the prior two cycles and Figure 4 clearly illustrates that this regime is not immune to cyclical booms and busts in asset values. Consumer caution is confirmed by mutual fund flow data in Figure 5 which shows that despite the great returns of recent years consumers at the retail level are taking money out of the US stock market, and these outflows have picked up precisely when the error on the consumption model started opening up. The current stock market rally does not appear to be driven by US consumer expectations for higher returns or greater purchasing power in the future. Keynes aptly quipped more than 80 years ago that markets can remain irrational longer than you can remain solvent, but continued consumer caution may be sowing the seeds of the next cyclical correction to what may ultimately prove to be a still elevated trend.
The author would like to thank Morris Davis and Sydney Ludvigson for useful feedback on this blog.
[1] Two of their seminal papers were “Consumption, Aggregate Wealth, and Expected Stock Returns” in the Journal of Finance published in 2001 and “Understanding Trend and Cycle in Asset Values: Reevaluating the Wealth Effect on Consumption” in the American Economic Review published in 2004.