Why lower housing inflation may also lock in low interest rates
Housing is one of the largest items in consumer budgets, and it is also therefore a lynchpin in measures of consumer inflation. Housing inflation has tended to be cyclical, strengthening toward the end of the business cycle. Perhaps not surprisingly the role of housing inflation has been somewhat different in the current cycle reflecting structural changes in demand for homeownership in the aftermath of the housing crash and Great Recession. Housing inflation has been a bedrock of recovery and stability for core inflation and now appears to be moderating after a multi-year boom in multi-family construction has finally brought supply in line with demand. If realized, continued moderation in rental inflation would be welcome news for consumers enjoying only moderate wage gains, but it would constrain the Fed’s ability to raise interest rates much further.
Housing is the Elephant in the Room; Health Care is the 800-Pound Gorilla
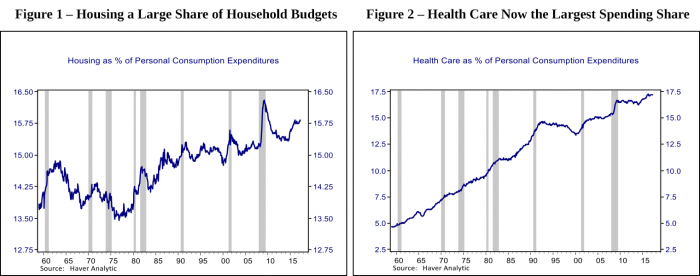
Housing has been the single largest share of household budgets in the United States for many decades. Figure 1 shows that housing excluding utilities and insurance comprised roughly 14% of aggregate consumer spending during the period between 1960 and 1980, after which it trended upward and now makes up closer to 16% of consumer budgets. In addition to varying over time, my colleague Stephen Malpezzi illustrated in a blog several weeks ago that the share of a given household’s budget spent on housing can vary widely by region of residence and tends to fall fairly dramatically with household income. For years housing was the single largest household expenditure, but Figure 2 illustrates that in the last decade that honor has gone to medical care, reflecting both an aging population and the fact that medical care inflation has generally outpaced overall inflation during the postwar period. Nevertheless, housing is a critical component of consumer budgets and therefore a lynchpin in steering tends in consumer inflation.
Consumption of, Versus Investment in Housing
Housing is unique in the consumer basket as it is both the largest consumption item, and for most households also the largest investment and store of wealth. Prior to 1983, both roles of housing were conflated in the measurement of hosing inflation included the costs to purchase a home such as house prices, interest rates, taxes, and insurance and repair costs. However, in the late 1970s and early 1980s violent swings in interest rates and volatility in home values contributed to significant volatility in measures of inflation.[i] There was also a long-standing debate about the appropriate way to capture the cost of housing in measures of consumer inflation, and the developments in the 1970s ultimately proved the catalyst for changing the way housing inflation is measured.
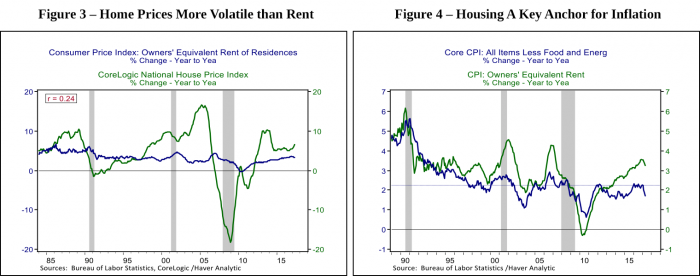
The method the Bureau of Labor Statistics settled on is referred to as a rental equivalence approach that attempt to extract only the consumption value of housing. For renters, the BLS surveys rents; for homeowners, the BLS surveys rents in the area where a homeowner lives, calculates what the home would likely rent for and uses that as the cost of housing for purposes of measuring consumer inflation. Essentially homeowners are treated as business owners who are renting their capital asset out to themselves.[ii] A person can choose to rent a home and invest their saving in equities and other assets, or they can invest in housing and effectively rent to themselves. Consumer price indexes are attempting to calculate the cost of living for US households regardless of whether they rent or own their dwelling and decided to try to abstract from any ebbs and flows in home values stemming from the investment value of housing. Figure 3 highlights that the booms and busts in house prices have been wildly more volatile than the movements in the owner’s equivalent rent measure of housing inflation in the CPI reflecting trends in interest rates, credit availability, business cycles and attitudes toward homeownership.
The Ironic Role of Housing Inflation After the Crash
Even as the rental equivalence concept of housing inflation is orders of magnitude more stable than home prices, Figure 4 highlights that is it nonetheless still more volatile, and generally higher than core inflation, which includes all items in the consumer basket except food and energy and is generally relied on as a bellwether of inflation trends.[iii] Owner’s equivalent rent (OER) has been running well ahead of core inflation on average since the mid-1990s, although in the past two expansions it was general in line early and mid-expansion with late cycle pops. In the current cycle housing inflation has been an increasingly important anchor to the recovery and ongoing stability in core inflation; the gap between OER and core inflation went from running more than a percentage point below core inflation in the early stages of the recovery to running well ahead. The gap has steadily widened through the cycle running a percentage point or more ahead of core inflation over the past two years.
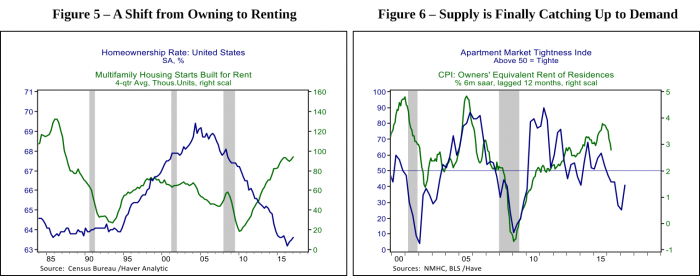
A variety of structural changes in the aftermath of the housing crash are combining to boost housing inflation in the CPI. As shown in Figure 5, homeownership has plummeted in the years following the Great recession with indications of stabilization at multi-decade lows coming only in the past two quarters. Declining homeownership reflects both continued tighter credit availability as well as changing attitudes toward housing. Yet even as housing values languished for several years during the recovery reflecting weak demand and bloated inventory, housing inflation in the CPI staged a much quicker recovery reflecting the shift toward renting and limited supply of rental units. Figure 5 also illustrates that very quickly after the crisis the multifamily housing sector began the most significant boom since the 1980s. However multifamily construction features longer planning and construction timing than the single-family sector and multifamily starts have only just leveled off over the past year.
Over the past six months housing inflation in the CPI has begun to moderate; Figure 6 illustrates that OER has moderated from 3.7% at a six-month annualized rate to 2.8% in May. Given that OER and rent together account for accounts for roughly 40% of core inflation, continued moderation would likely be felt in the overall trend. Figure 6 also plots housing inflation against a measure of tightness in the apartment market calculated by the National Multi-Family Housing Council which has moved from indicating very tight market conditions early in the recovery to loose conditions in the past two years. The leading relationship between the Apartment Market Tightness Index and Owner’s equivalent Rent in the CPI suggests that further moderation in housing inflation is a plausible forecast. Indeed a check of major metropolitan areas where CPI housing inflation has been moderating confirms that these are also cities that have seen booms in multi-family construction and where supply conditions are starting to ease.
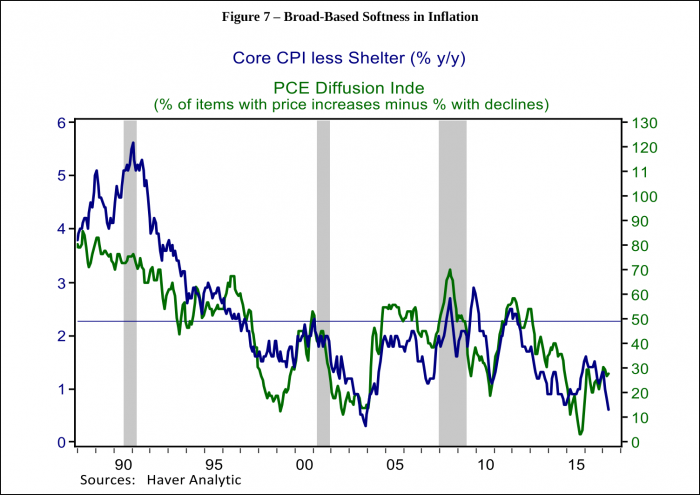
In my blog on low inflation trends two weeks ago I concluded that a longstanding headwind to inflation from improvements in technology combined with an ongoing caution and price sensitivity on the part of consumers is contributing to broad-based weakness in inflation. Figure 7 shows a diffusion index of consumer prices from the Personal Consumption Expenditure Price index calculated as the percent of goods and services with rising prices minus the percent with falling prices. Currently the index stands at 28, with 64% of items in the consumer price index seeing increases versus 36% with falling prices. Historically core inflation hasn’t reached the Fed’s 2% goal for core inflation without the diffusion index being closer to 50. The chart plots the Diffusion index against Core CPI inflation excluding the shelter components highlighting the breadth of subdued pricing. For the last several years housing inflation has masked that underlying trend of weakness, and while the Fed is hoping the recent low readings reflect transitory factors, it is quite possible it will be more persistent. Relief from rapidly rising rents would no doubt be welcome news for many consumers, particularly given how subdued wage trends have been and rising affordability problems in many metropolitan areas. However, it also suggests the choices confronting monetary policy makers may be fairly constrained.
[i] See Detmeister, Alan, and Edward Hulseman (2017). “Was There a Great Moderation for Inflation Volatility?,” FEDS Notes. Washington: Board of Governors of the Federal Reserve System, June 29, 2017.
[ii] See Poole, Robert, Frank Ptacek, and Randal Verbrugge “Treatment of Owner-Occupied Housing in the CPI,” Paper presented to the Federal Economic Statistics Advisory Committee (FESAC) on December 9, 2005 (PDF)
[iii] In Figure 4 there is a dashed line at 2.25%, which is roughly equivalent to the Fed’s target for its preferred gauge of Core PCE inflation since CPI has historically run 0.25% ahead of core PCE inflation.


