
Is it back to the future or go the way of Japan?
The Congressional Budget Office finally released its annual 10-year budget outlook, incorporating the most recent tax cut and increase in government spending. The news isn’t good. Recent legislation has made an outlook already challenged by our failure to fund social insurance programs for our aging population even worse. Owing to an unusually high number of expiring provisions, the likely outcome is even worse than the CBO’s baseline. If a garden-variety recession is factored into the outlook some time over the next ten years it seems quite likely that the ratio of federal debt to GDP is set to exceed the post-World War II peak of 106% by 2028. We have highlighted the possibility that rising debt issuance combined with a failure of foreign appetite to keep up and a reduction in the Fed’s Treasury holdings could continue to push longer-term interest rates higher this year, and the CBO projects the yield on the 10-year Treasury will reach 3.25% by year end and peak at 4.25% in 2022. However rising debt servicing burdens from higher rates could force the Fed back in the game of holding rates down by expanding its balance sheet. Japan provides a cautionary tale of where this experiment might lead.
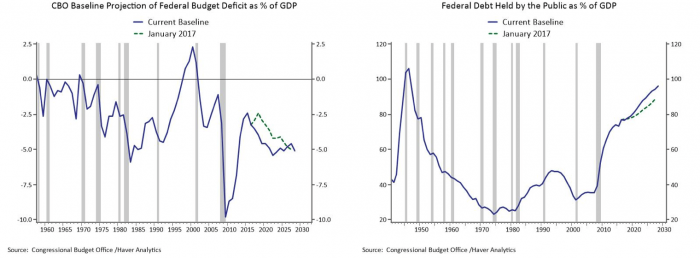
The Congressional Budget Office (CBO) released its ten-year outlook for the federal budget last week. The report is usually released every year in January, but the CBO delayed the release so it could fully analyze and incorporate the Tax Cuts and Jobs Act that was passed in late December, as well as the fiscal spending package for 2018 and 2019 that wasn’t finalized until March. The report shows the federal budget outlook going from bad to worse. Whereas deficits were projected to widen significantly over the next ten years reflecting the pressures of an aging population, they are now projected to widen immediately and remain much larger than historical norms indefinitely leading federal debt to rise to nearly 100% of GDP by 2028 (Figure1). The only time the US government has taken on that much debt relative to GDP was in the immediate aftermath of World War II, after which the baby boom ushered in a period of sustained economic expansion and relatively high inflation that helped pay it down. While there are always multiple sources of uncertainty around these projections, the US is neither as dominant globally nor as vibrant demographically. The troubling reality is that the CBO’s projections are likely too conservative.
Figure 1: The US Government is Setting Sail on an Unprecedented Experiment
An Aging 800 Pound Gorilla
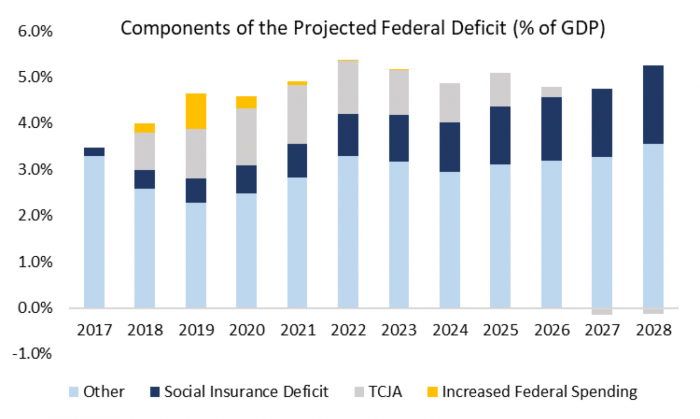
Figure 1 makes clear, the US fiscal outlook was already challenging before the recent deficit expanding policies were put in place. Figure 2 highlights that this is in large part a structural issue stemming from a general lack of fiscal discipline as well as the underfunding of federal programs that support an aging population. The chart indicates there is an underlying deficit worth roughly 3% of GDP. In addition, there is a growing demand for funding coming from growing deficits in the social security, disability and Medicare programs, collectively referred to in the chart as the social insurance deficit.
There is a somewhat convoluted accounting construct around federal social insurance programs. Government trust funds were established when these programs were in surplus with the aim of earmarking and protecting their finances. In simple terms, as long as contributions exceeded benefits these programs effectively lent money to the government, reducing the need to raise money from investors through the issuance of Treasury bonds. As these programs slip into deficit, the government must pay back the programs for the money lent, thereby increasing the need to raise money from investors above and beyond the underlying deficit. Benefits already exceed contributions in the social security program, and Medicare is expected to slip into deficit in 2019 and the disability program in 2020.
Figure 2: The Decision Not to Fund Benefits for an Aging Population is the Main Driver of Deficits
It’s Probably Going to be Worse Than it Looks
The CBO’s estimates of the net impact of the Tax Cuts and Jobs Act of 2017 (TCJA) incorporate any increased revenues resulting from the likely boost to growth. Indeed, the CBO is using optimistic multiplies and has a solidly above consensus GDP forecast of 3.3% in 2018 and a still above trend of 2.4% projected for 2019. The outlook for the economy and the budget gets more complicated in 2020. In order to fit under certain caps required to jam the TCJA through quickly on a partisan vote, the law includes a number of provisions set to expire. Individual tax cuts are set to expire in 2025. Full expensing of investments expires after 2022. Several healthcare-related taxes set to take effect were temporarily delayed. In addition, the increase in federal spending caps is set to expire in 2020. Allowing all the currently scheduled temporary provisions to expire as scheduled implies that a fiscal tailwind turns to a headwind starting in 2020 unless provisions are extended. The CBO stopped short of predicting a recession in 2020, although GDP growth is expected to slip below trend, and the unemployment rate is projected to rise as hiring slows to nearly a standstill.
Politicians are unlikely to stand still in the face of a stumbling economy and it seems reasonable to assume there is a good chance expiring provisions are renewed. In light of increased uncertainty stemming from the abundance of expiring measures, the CBO revived its practice of including an alternative scenario in addition to their baseline outlook. The alternative scenario assumes many key provisions are extended resulting in larger deficits and a ratio of debt to GDP of 105% by 2028. The nonpartisan Committee for a Responsible Federal Budget makes a slightly different set of assumptions regarding likely fiscal decisions and estimates that debt to GDP will more likely reach 107% of GDP, which would just exceed the post-World War II record.
It is always easier to give than to take away. There are no easy answers if at some point fiscal authorities decide to stabilize deficits at about 4% of GDP (accounting for a wider underlying run rate in an aging society). For example, a back of the envelope calculation suggests taxes on the top quarter of income earners would have to rise between 5% and 10% to achieve such an objective and avoid a reduction in social insurance benefits.
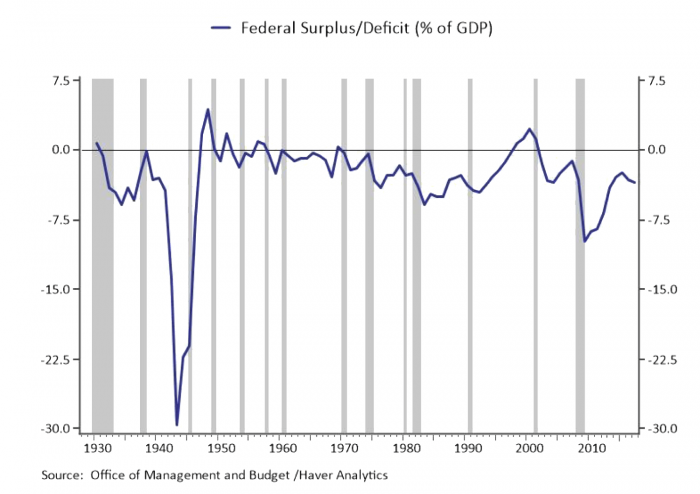
The main missing element from even these more startling calculations is that they don’t factor in the high likelihood that the economy will be hit by a recession some time over the next ten years. Figure 3 highlights that the federal deficit is highly cyclical, narrowing as the economy strengthens and widening in a recession. There are a number of automatic stabilizers in fiscal policy including unemployment insurance, a variety of means-tested social insurance programs, a progressive tax code and the other features of the tax code such as loss carry forwards that are intended to provide support to households and businesses in hard times and then remove that support when times are good. Recessions often feature additional tax cuts or other legislated measures to support the economy in hard times. Aside from the record deficits registered during and after the Great Depression and World War II, the average post-war decline in the federal deficit from the pre-recession peak to the post-recession trough has been nearly 4 percentage points of GDP. Figure 3 highlights that wide deficits often persist for years as a recovery takes hold. Factoring in a garden-variety post-war recession into the budget outlook could easily add another 5 percentage points to the ratio of debt to GDP.
Figure 3: Federal Deficits are Highly Cyclical, A Downside Risk to the Fiscal Outlook
How Did We Get Here and What Does It Mean?
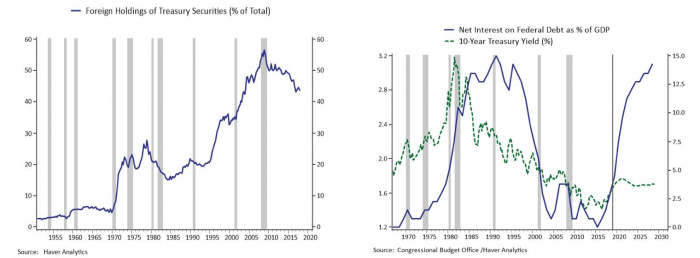
I won’t opine on the forces producing rising populism and increased political polarization here, which is not to say it isn’t an important driver of our collective decision to take increasing risks with US fiscal credibility. I have often written about the influence of the global savings glut, the massive accumulation of dollar reserves by China and other countries as the pace of globalization accelerated in recent decades. Those dollar reserves had to be reinvested in dollar assets and are often thought to be a key influence behind persistently low longer-term bond yields dubbed the “bond conundrum” by Alan Greenspan in 2003. The left panel of Figure 4 shows that the reinvestment of foreign reserves into Treasuries led to more than a doubling in foreign ownership of Treasuries between 1995 and the peak of 55% reached in 2008. The share of foreign ownership has been moderating over the past decade when the Fed picked up the slack by expanding its balance sheet. Fiscal authorities have tempted fate several times in recent years by threatening default of short-term debt inspiring a credit downgrade of the US and shutting the government down only to be met with ever lower borrowing costs as investors bought Treasuries as a safe haven from the resulting uncertainty. Economists firmly believe that incentives matter, and the lack of market reaction has incentivized fiscal policy makers to explore the boundaries of what’s possible.
We have highlighted the possibility that rising debt issuance combined with a failure of foreign appetite to keep up and a reduction in the Fed’s Treasury holdings could continue to push longer-term interest rates higher. The right panel of Figure 4 leads us to ponder an additional risk. The CBO projects the cost of servicing the federal debt will rise from 1.4% in 2017 to 3.1% of GDP by 2028, a federal debt servicing burden not seen since the 1980s. They project that the yield on the 10-year Treasury will indeed rise on the back of this issuance to 3.25% at the end of this year and a peak of 4.25% in 2021. An increase in interest rates of this magnitude will imply a meaningful increase in borrowing and debt servicing costs for businesses and consumers.
Figure 4: The Support from Foreign Buyers May be Fading as the Supply of Debt Will be Rising
In a slower growing economy such a rise in interest rates itself could be a shock that slows the economy, and with limited fiscal space the Fed would be forced by its dual mandates to find a way to lower rates and support the economy. With limited scope for cutting short-term interest rates, it seems recent fiscal developments raise the likelihood the Fed may need to expand its balance sheet again at some point. Japan provides a cautionary tale here; government debt stands at 197% of GDP and the Bank of Japan (BoJ) has been engaged in balance sheet expansion for the better part of 20 years with no end in sight. The BoJ’s balance sheet is currently 95% of GDP, as compared to the Fed’s holdings worth 22.5%, and they own roughly 40% of market debt outstanding. Long-term rates have fallen, not risen, on the back of Japan’s fiscal largess thanks in part to the BoJ’s support. The possibility that the Fed may have to offset the impact of fiscal expansion at some point with renewed bond purchases may be one reason 10-year Treasury yields have struggled to push beyond 3%.
The political concept that we are somehow going back in time is contradicted by recent developments in fiscal policy and what they may imply for monetary policy. We continue to ride the new frontier and explore the boundaries of what’s possible in this relatively uncharted territory. That leaves us with few tried and true metrics to rely on, although it seems like the risk is likely skewed to rising short and long-term interest rates at least in the near term.