
Taking the long view on New Jersey's housing affordability
Two weeks ago we took a broad look at housing “affordability” at Rutgers’ BlogˑRE. It surely surprised very few readers that we found that residents of New Jersey – and our Connecticut and New York neighbors – spend a lot on housing, especially on rents. Exhibit 2 from that previous post showed that New Jersey ranked number 5 in median monthly gross rents ($1190). Our tri-state neighbors, New York ( $1120, ranked #7) and Connecticut ($1070,(ranked #10) were also high.
In that previous post we promised to dig deeper, and produce a series of blog entries that explored the potential effectiveness of some proposed solutions to the high cost of housing in New Jersey and other states. Today we will examine rent controls, government regulation of rents in the private rental market. When rents are high and/or rising, simply legislating lower rents and/or slower increases has an obvious superficial appeal. It’s a simple and direct approach, at least in theory. Unfortunately, as we will see, rent control turns out to be far from simple or direct and practice.
One reason we chose rent control as our first candidate housing policy for study is that about 120 New Jersey jurisdictions already regulate rents in some manner. Given recent reports of rapidly rising rents, a number of jurisdictions in New Jersey and elsewhere are actively discussing strengthening existing rent controls, or instituting them where they don’t yet exist. A few places that have recently relaxed some rent regulations, including my home state of Massachusetts as well as Newark, are debating the pros and cons of re-regulating. An overview articles by Teresa Wiltz, several articles on Newark by Karen Yi and Naomi Nix, reportage on the Boston debate by Pamela Ferdinand, debates in Glassboro covered by Carly Romalino, are examples any Internet search will quickly turn up; the debates in California alone are too numerous to catalog here.
But it’s not just tenant advocates, landlords and pundits entering into the rent control fray. No less an authority than the Tri-State Regional Plan Commission has called for the imposition of rent controls in markets without them, and strengthening controls in already controlled markets:
New Jersey and New York are two of only four states in the U.S. where localities are able to regulate and limit these rent increases. While some jurisdictions – most notably New York City through its Rent Stabilization system – take advantage of this, many do not. Municipalities in New York and New Jersey could make greater use of this authority to help prevent displacement directly, although rent regulations need to be coupled with proper enforcement and oversight to be most effective.
…
While the specifics of rent regulations will and do vary by municipality, it is important that states move to strengthen—or in the case of Connecticut, enable—rent regulations at the municipal level where displacement is a concern. (Rent regulation is preempted in Connecticut, tenant-protection ordinances do exist and vary by municipality.) These could include some limit on the amount, frequency and timing of rent increases and allowing for the right to a renewal lease, requiring minimum services for tenants, and limiting the grounds under which tenants can be evicted to nonpayment of rent or violation of an existing lease. Furthermore, municipalities can require new housing that receives government subsidies or tax incentives to enter any rent regulation system, as is currently done in New York City.
Doubtless many readers are already aware that economists have long argued against rent controls as a solution to high housing costs. Simple supply and demand analysis suggests that controlling prices usually leads to shortages of the good in question. The Econ 101 analysis suggests that developers will build fewer units (at least for any controlled rental market); Figure 2 on page 43 of Turner and Malpezzi reproduces this familiar analysis. Other models suggest that landlords of controlled units will reduce maintenance and accelerate the physical depreciation of the unit, although as Edgar Olsen has shown this depends on what other housing quality regulations might exist. That free market oriented economists like Milton Friedman and George Stigler emphasize these unintended consequences is unsurprising to anyone who has had a semester of economics and recognizes the names; but consider this quotation from the other side of the spectrum, from Paul Krugman’s New York Times column:
The analysis of rent control is among the best-understood issues in all of economics, and — among economists, anyway — one of the least controversial. In 1992 a poll of the American Economic Association found 93 percent of its members agreeing that ”a ceiling on rents reduces the quality and quantity of housing.” Almost every freshman-level textbook contains a case study on rent control, using its known adverse side effects to illustrate the principles of supply and demand. Sky-high rents on uncontrolled apartments, because desperate renters have nowhere to go — and the absence of new apartment construction, despite those high rents, because landlords fear that controls will be extended? Predictable. Bitter relations between tenants and landlords, with an arms race between ever-more ingenious strategies to force tenants out … and constantly proliferating regulations designed to block those strategies? Predictable.
To foreshadow the rest of this blog entry, it’s going to turn out that rent control is not as simple as Milton Friedman and George Stigler and Paul Krugman make it out to be. But in the end, after examining rent control in its real-world complexity, we are going to end up in much the same place. Rent control is not, in general, an effective solution for housing affordability problems. But getting to that conclusion is going to require a little extension of the usual Econ 101 analysis.
What Exactly Is “Rent Control”?
Rent controls can be found in many countries around the world; a World Bank study undertaken in the 1990s estimated that about 40 percent of renters worldwide were under some significant form of rent control. This fraction probably declined somewhat, as a number of countries such as the United Kingdom have eliminated or relaxed controls; although recently countries as diverse as Germany and Korea are considering imposing or tightening such controls. In the U.S. many metropolitan areas had rent controls during World War II; but afterwards most locations eliminated such controls, so that by the 1990s only a handful of states including New Jersey and New York had markets under controls. (As far as I’ve been able to determine, no Connecticut cities have controls, and a 1959 court case seems to prohibit controls; although a recent review by Werness suggests that in extreme conditions some rent regulations might pass judicial muster). In the 90s Massachusetts opted out of controls at the state level and so now the only rent controls in the U.S. are found in California, Washington DC, Maryland, New York and New Jersey. Sources for more detailed information on the details of individual rules can be found at the end of this post. Suffice it to say for now that rent control regimes vary enormously in their design and in their effects.
For example, one key feature is whether regulations set the level of rents, or control increases in rent. Others include how controlled rents are adjusted for changes in costs (with cost pass-through provisions, or adjustments for inflation); how close the adjustment is to changes in market conditions; how it is applied to different classes of units; or whether rents are effectively frozen over time. Other key provisions which vary from place to place include breadth of coverage, how initial rent levels are set, treatment of new construction, whether rents are reset for new tenants, and tenure security provisions. Rent control’s effects can vary markedly depending on these specifics, and on market conditions, as well as enforcement practices.
For example, in New York City – by far the most studied controlled market in the United States – there are three main classes of rental housing. Controlled rental housing comprises mainly pre 1947 apartments, whose rents are set on what is roughly a (financial) cost plus basis. Since 1969, units built after 1947 (and some pre 47 units which had been decontrolled) have been subject to “rent stabilization,” under which a board comprising landlord, tenant and “general public” representatives set annual guidelines for percentage increases. Since 1971, both controlled and stabilized units are removed from the system whenever tenants turn over, but since 1974 once new tenants negotiate rents the units come under stabilization once again.
As another example, Los Angeles has had rent control in place since 1978. But compared to New York its regulatory framework is fairly flexible. New construction, “luxury” units and detached units are exempt; about 63 percent of rental units fall under controls. Rents are reset for new tenants by negotiation, and increases thereafter are limited to the consumer price index. Evictions are permitted for “just cause.” There is a “sunset provision” which provides for the end of controls if the rental vacancy rate reaches five percent.
Our focus in this post is the United States, but it’s worth noting that there’s much to learn from rent controls in other countries. Compared to most controlled U.S. and Western European markets, many developing country and emerging formerly socialist markets tend to have stricter regimes (more setting of levels rather than regulating increases, fewer exemptions for small landlords or new units, etc.). Generally, comparative research finds than while qualitative outcomes of controls are often similar, magnitudes differ.
Some Exploratory Data Analysis of U.S. Metropolitan Areas and Divisions
If rent controls are effective, presumably we would find lower rents and controlled markets, other things being equal. But housing markets – metropolitan areas and divisions in today’s analysis – vary widely in their resident’s purchasing power. In 2010 citizens of Brownsville, TX had a median household income of around $32,000; at the other extreme, citizens of Bethesda, MD had median household incomes of about $91,000. One natural and simple control is to examine rent-to-income ratios, or budget shares. Some researchers argue that budget shares are roughly constant across income, but most careful microeconomic research finds that housing is a “necessity,” i.e. budget shares tend fall as incomes rise (see Green and Malpezzi). Exhibits 1 and 2 begin our examination of how budget shares are affected (or not) by rent controls with some simple exploratory data analysis. Exhibit 1 will examine budget shares for about 300 uncontrolled markets, and Exhibit 2 will examine the budget shares for the much smaller number of rent controlled markets for which we have data (14).
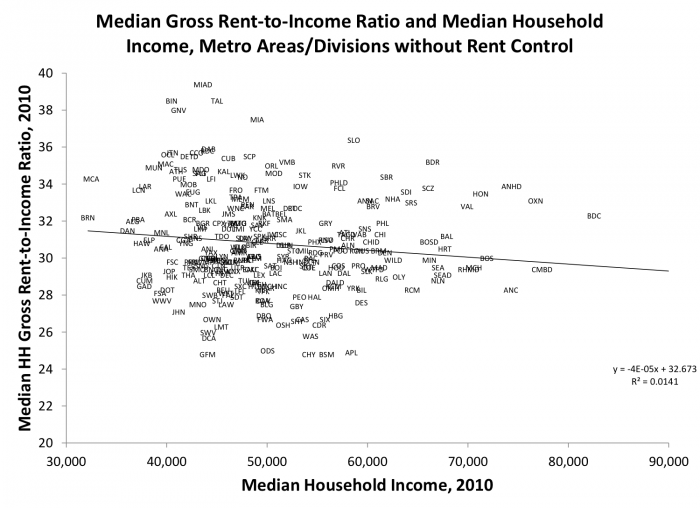
The American Community Survey (described at the end of the post) draws a sample from each place (metropolitan area or division) and computes each sampled household’s gross rent (rent plus basic utilities) divided by the sampled household’s income. Then Census computes the median of these household-level calculations for the sample drawn from each location (metro area or division). Census also calculates the median household income for each location. In Exhibits 1 and 2 we plot the each location’s median budget share by its median household income. Each place is represented by a 3 or 4 letter code; interested readers can obtain the codes from this link.
The first Exhibit shows these median rent-to income ratios plotted against the median household incomes for the roughly 300 places for which we have data which are not under rent control. You can see that there is a lot of variation in both median incomes, and median budget shares. Places like Great Falls MT, Odessa TX and Appleton WI have median rent-to-income ratios of around 25 percent; while places like Gainesville, Miami and Tallahassee FL, and Bloomington IN approach median budget shares of 40 percent. The regression line through all the plotted locations shows a very slight decline in median budget shares as metro incomes increase. The predicted median budget share for a metro area is about 31 percent for a location with a median household income of $30,000; the predicted share falls only slightly to 30 percent when income rises to $50,000, and to 29 percent when incomes rise to $70,000, and to about 28 percent when incomes rise to $90,000. But most of the variation lies around the regression lines; less than 2 percent of the variation in metro budget shares is explained by a location’s median income.
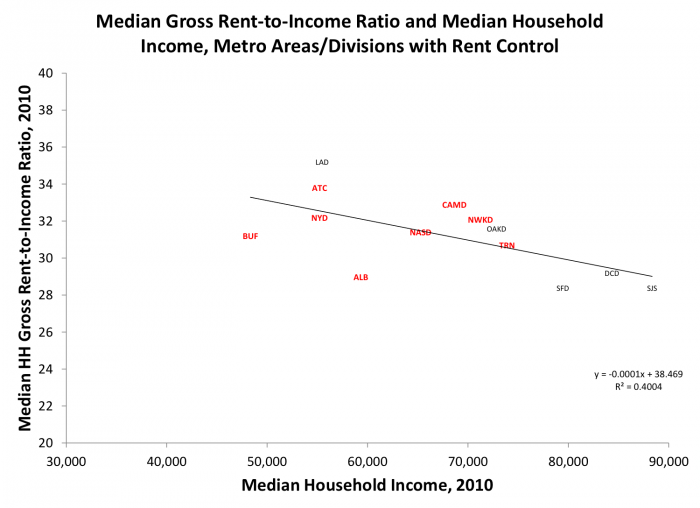
Exhibit 2 presents the same framework as Exhibit 1 but this time using the relatively small number of Metropolitan areas and divisions for which we have data and which are under rent controls. Rent-controlled locations within the tri-state area are in red (Buffalo, Atlantic City, New York, Nassau (Long Island), Albany, Camden and Trenton); the other markets for which we have data are either in California or the District of Columbia. While the fit is not extremely tight, this time about 40 percent of the variation in location budget shares is associated with the location’s income. Of course, comparing a chart with only 14 points to one with 300 justifies our use of the word “exploratory” data analysis. Also notice that except for Buffalo none of these locations have median household incomes below $50,000, and DC and San Jose are among the richest locations in our total sample. Using the regression line as before to predict budget shares at different levels, the predicted median budget share for a controlled metro area with a median income of $30,000 is about 35.5 percent (compared to 31 percent for an uncontrolled location with the same income, from Exhibit 1). At each income level within the relevant range, the predicted budget share for a rent controlled location is actually higher than in the corresponding uncontrolled location: a budget share of 33.5 percent at $50,000 (compared to 30 percent above), 31.5 percent at $70,000 (compared to 29 percent above), and 29.5 percent at $90,000 (compared to 28 percent above).
Perhaps we should not be surprised that we don’t see any major reduction in rents (or more specifically the rent-to-income ratio) in controlled markets, since one hypothesis is that it’s in high-cost markets where controls are least likely to be removed during the great postwar elimination and relaxation from controls. Correlation, as always, is not causality. But at least we now have some data that suggests that that the relatively small number of controlled U.S. markets haven’t obviously “solved” their affordability problem.
It’s often asserted that rent controls will reduce housing supply. What do simple descriptive data tell us about that? The next two Exhibits examine building permits per thousand population, a simple measure of new housing supply, as a function of metropolitan population growth.
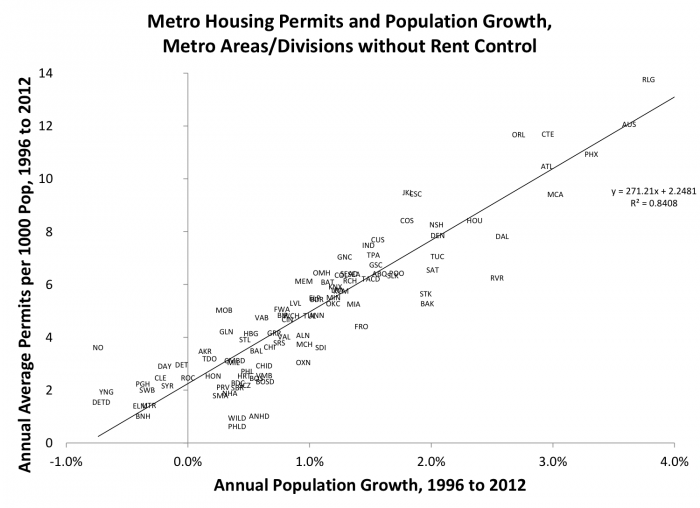
Exhibit 3 shows a fairly strong correlation between population growth and building permits; about 84 percent of the variation in permits per thousand is associated with population growth. For every 1 percentage point increase in population growth, building permits per thousand go up by about 2.7. At a population growth rate of zero, the regression predicts a location will still be building about 2.2 units per thousand. At 1 percent population growth, developers build an average of about 5 units per thousand, at 2 percent about 7.7 units per thousand, at 3 percent about 10.4 per thousand, and at 4 percent growth about 13 per thousand.
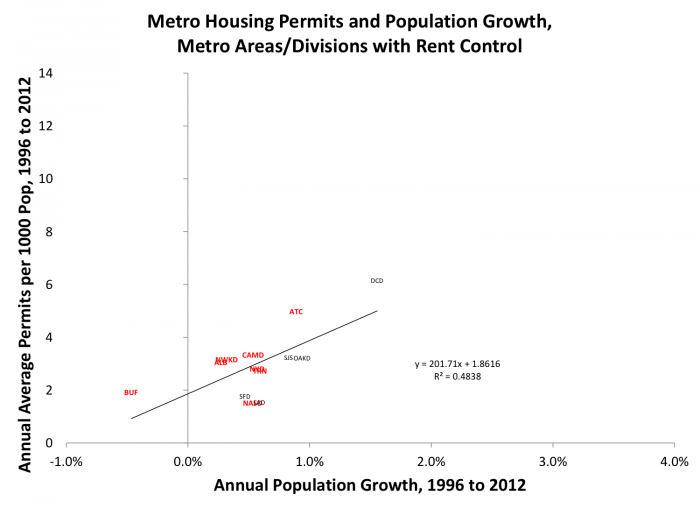
Turning now to our small sample of rent controlled metropolitan areas and divisions in Exhibit 4, we do see lower housing production, conditional on population growth. This time only about 48 percent of the variation in permits per thousand is associated with population growth. For every 1 percentage point increase in population growth, building permits per thousand go up by about 1.9 (compared to 2.7 above). At a population growth rate of zero, the regression predicts a location will still be building about 1.9 units per thousand, not too much of a reduction from 2.2 we found in Exhibit 3. But the gap increases as population growth increases. At 1 percent population growth, developers in controlled markets build an average of about 3.9 units per thousand (compared to 5 above), at 2 percent about 5.9 units per thousand (compared to 7.7), at 3 percent about 7.9 per thousand (compared to 10.4), and at 4 percent growth about 9.9 per thousand (compared to 13).
To reiterate, we point out again that the simple two-way plots are far from the last word. The charts presented here are simple measures of association. There purely descriptive, they don’t “prove” that rent control causes any increase or decrease in rents or housing construction. Correlation is not causality is drummed into every student of economics or statistics, and for good reason. Nevertheless, examining such descriptive patterns is always a good starting point for examining any important question.
Taking these exploratory results at face value for the moment, controlled markets don’t seem to exhibit lower rent-to-income ratios than uncontrolled markets; if anything they are larger. U.S. markets which are controlled do have some new construction; other research has split this out into building for rental units versus for homeowners and have occasionally found increases in rent control stringency pushing more construction into the homeowner sector, which would be no surprise.
Results from Research beyond Simple Descriptive Plots
Static Analysis
Static analysis takes the current stock of units as given, and considers how costs and benefits are distributed. Studies which calculate the static cost born by owners of existing rental units show that the reductions from market rent can be substantial, but that tenants, in general, value the implicit subsidy of controls less than it costs.
The “static” costs of controls to landlords are the difference between the controlled rent they are allowed to charge for a particular unit and the market rent for that unit in the absence of controls. Obviously this cost is also the implicit subsidy to the tenant from controls. But the tenant may value this implicit transfer less than an equivalent amount of money income.
For example, suppose a unit would rent for $300 in the absence of controls, and the controlled rent is $100. The landlord loses $200 and the tenant gains a $300 unit for $100. If the tenant would happen to demand a more or less identical unit in the absence of controls, his or her benefit is also $200, and we say the “transfer efficiency” of controls is 100 percent; that is, the benefit to the tenant is equal to the landlord’s cost. We may or may not like the idea of transferring income from landlord to tenant in this fashion, but that is a separate issue.
Now consider the case when the tenant would, in the absence of controls, choose a larger unit (which would rent for, say, $500). Assume the tenant is in our original controlled unit; he or she receives $300 worth of housing services for $100, so they save $200. But to receive this transfer, they have had to reduce their housing consumption, and our net benefit measure should adjust for that. In the jargon of economics, the household has lost “consumer’s surplus” from having to move to a smaller unit to get the rent control discount. The concept is discussed in more detail in any introductory economics text, and the magnitude of such changes can be estimated using econometric techniques (see references). Suppose the lost consumer’s surplus was estimated using such methods, and found to be $55; the household’s net benefit would be $200-$55, or $145. In this example, the landlord incurs a cost of $200 to benefit the tenant only $145. The “transfer efficiency” is only 72 percent. Landlords incur a cost of $1.38 for every $1 of tenant benefit.
One of the first published studies of the costs and benefits of rent control along these lines is Olsen’s. Using data from New York City in 1968, Olsen found the average controlled rent for an apartment was $999 per annum (for comparison, the average income was $6,229). Olsen first estimated how much the controlled units would rent for in the absence of controls. The average estimated uncontrolled rent for controlled units was $1,405, implying a subsidy (static cost to landlords) of $406. Olsen next estimated how much households in controlled units would spend in the uncontrolled market, given their income and family size. The average estimated market expenditure for the controlled households was $l,470, indicating that they consumed slightly less housing than they would have in the free market. Olsen then computed the economic benefit of rent control to each surveyed controlled tenant using a simple consumer’s surplus model. Olsen’s estimate of the average net benefit is $213, little more than half the gross subsidy of $406.
Examining the distribution of these benefits among controlled households, Olsen found the annual benefit decreased by about one cent for every dollar of additional income, $9 per year of head’s age, and $69 per additional household member. Rent control in New York City in 1968 appears to redistribute income, but very weakly, and in no way proportional to its cost.
A number of other studies have been carried out along these lines (Malpezzi reviews several). For example, in Cairo, Egypt, monthly rents for a typical unit are less than 40 percent of estimated market rents. “Key money” (illegal upfront payments to landlords) and other side payments make up about a third of the difference. In Amman, Jordan, the static cost of controls is about 30 percent of estimated market rent; the benefit to the typical tenant is only 65 percent of cost (Struyk).
Dynamic Analysis
Rent control can also impose dynamic costs (i.e. undesirable changes in the stock of housing over time). Controls can reduce dwelling maintenance, reduce the useful life of dwellings, and inhibit new construction. Controls provide strong incentives to convert rental units to other uses. These market responses shift the incidence of rent control’s costs forward to tenants, over time. It is theoretically possible to design a rent control regime which does not discourage maintenance and starts with a pricing scheme which rewards maintenance and new construction. In practice, revaluation and maintenance inspections are expensive and difficult to organize; and new construction can still be adversely affected by the expectation of future controls.
The first careful dynamic rent control analysis, of Los Angeles, was carried out by the Rand Corporation (see Murray et al. (1991)). Peter Rydell, Michael Murray and their colleagues built a simulation model which predicted the time path of rents and the quantity of housing services given alternative changes in the regime. An aggregate stock adjustment model was estimated using pre-control data from Los Angeles. This yielded estimates of changes in the stock itself (removals, conversions, new construction) given changes in price. Given these results, the Rand team could simulate how different limits imposed by alternative control schemes would change the time path of rents; could then decompose these changes into changes in price and changes in quantity; and then, given assumptions about demand, could measure changes in consumer’s surplus over time.
Key results include the following. First, the magnitude of the effects varies substantially with details of the regime. For example, a two percentage point reduction in the allowable percentage increase in rents for occupied units increases the aggregate rent reduction by 45 percent, but increased tenant losses from accelerated depreciation and lost consumer’s surplus were a similar percentage. Other simulations using alternative changes in the rules for increasing rents, and in rules about coverage, had different quantitative results. In general, the Rand report suggests that dynamic losses can be substantial; in fact they outweigh static consumer’s surplus losses by as much as a factor of 18. Generally tenant benefits are were again substantially less than landlord costs; the transfer efficiency in three representative cases ranged from 65 percent to 83 percent.
Given their apparent importance, dynamic effects of controls are understudied. For example, no one has yet credibly analyzed the effects of controls on the aggregate supply of housing. Despite many studies which imply controls qualitatively reduce returns to rental investors, given the myriad ways real world regimes work and ways around controls (legal and illegal) the size of the net aggregate effect on supply remains unknown. Reviews of the theoretical literature by Arnott, and of the empirical literature by Turner and Malpezzi, point out that empirical work lags theory in this area. Malpezzi did find that countries with stricter rent control regimes invested less in housing, in the aggregate; but while controls were implemented for demand (income and demographics), constraints on housing markets (e.g. land use constraints, financial constraints) were ignored. Since these may well be correlated with the strength of controls, the jury is still out.
Distributional Issues
One reason controls appeal to many is because they are believed to transfer income from supposedly wealthy landlords to poor tenants. But much remains to be learned about the actual distributional effects of controls. There are three main questions of interest, related to (1) the distributional effects between landlords and controlled tenants, (2) the distributional effects between controlled tenants and uncontrolled households (homeowners and uncontrolled tenants), and (3) distributional outcomes within the class of controlled tenants.
Such evidence as exists casts doubt on controls’ effectiveness as income transfer mechanisms. In Cairo and Bangalore, for example, no relationship was found between the benefits gained from reduced rent and household income, because rent control is not well targeted to low-income groups. In Kumasi and Rio, benefits were found to be somewhat progressive (Malpezzi). Recent research on New York controls by Glaeser and Luttmer is another in a series of papers that find substantial “noise” in the allocation of rent control benefits.
Another questionable assumption behind redistribution as a rationale for controls is the notion that landlords are rich and tenants are poor. In Cairo, Kumasi and Bangalore, the income of tenants and landlords was compared; and, while the landlords’ median income was higher in all three, there was significant overlap. In Cairo, for example, about 25 percent of tenants had incomes that were higher than the landlord median, and about 25 percent of landlords had incomes lower than the tenant median. There is no guarantee the transfers will only occur from high-income landlords to low-income tenants.
Some tenants are, on balance, worse off under controls because of constraints on housing consumption. And in markets with significant uncontrolled sectors, rent controls can drive up the price of uncontrolled housing, an important unintended consequence further complicating the incidence of its costs.
The Bottom Line
Early models of rent control, the kind usually found in economics principles texts, suggest that regulating rents will lead to dramatically reduced supply from decreasing construction and accelerated depreciation. Simple evidence we presented here, and the preponderance of more detailed research, suggest these effects have been found. But the kinds of rent control systems we have in the United States, which mainly limit rent increases (rather than set rent levels well below market, as sometimes found in other countries) are associated with decreases in supply but do not shut off development completely as feared by early analysts like Milton Friedman and George Stigler. Furthermore, rent control is often inefficient in the sense that the benefit delivered to tenants is often much less than the corresponding cost to landlords.
The distribution of benefits from controls is rarely related to any measure we’d use to target housing assistance by income or other measure of need. The sparse evidence we have on landlord income suggest that while landlords are richer on average than tenants, landlord and tenant incomes often overlap. Small scale landlording is often an important point of entry for potential entrepreneurs.
The “bottom-bottom line” can be stated succinctly: Rent control rarely has the catastrophic effects some early economists suggested, but neither does it deliver effective and targeted relief to households that we would identify as having the strongest housing needs. Once installed, politically rent controls become very hard to modify or remove if they do begin to become more binding on supply.
Other approaches like housing vouchers and changes in building codes land use and development regulations and the like are likely to have a much more positive impact on housing affordability issues in New Jersey and elsewhere. We’ll have more to say about those in future posts.
Details I: Metropolitan Definitions
Our exploratory data analysis used metropolitan areas and divisions without explanation. Here’s a quick summary of these and some other related Census locations.
All the definitions we discuss here are based on collections of one or several counties that are economically linked to one or more principal cities. The starting point is something Census calls a Core Based Statistical Area (CBSA). These are one or more counties that contain at least one urban cluster/urbanized area with at least 10,000 population. These are subdivided into Metropolitan Areas (county based, with at least one urbanized area with at least 50,000 population), and Micropolitan Areas (similarly county based, with a principal city/urban cluster of between 10,000 and 50,000 people).
Some metropolitan areas are of modest size and comprise only a single county, like Norwich-New London. Most have two or more counties. The extreme case is New York, the largest metropolitan area, comprising 25 counties in New York, New Jersey, and Pennsylvania. Many of New Jersey’s largest cities are part of the New York and Philadelphia metropolitan areas. Large metropolitan can contain one or more Metropolitan Divisions; so Newark is part of the large New York Metropolitan Area (CBSA) but also headlines its own Metropolitan Division.
Where metro divisions exist, we use them, so we can split off Newark from New York, Camden from Philadelphia and so on. The (mostly 3 or 4 letter) codes we use to identify locations on the plots can be found at this link.
Details II: Data Sources
Our data on rents, incomes, and rent-to-income ratios (budget shares) comes from the 2010 data set of the American Community Survey (ACS). The ACS was instituted to replace the discontinued “long form” of the Decennial Census.
The ACS provides estimates of demographic, housing, social, and economic characteristics every year for all states, as well as for all cities, counties, metropolitan areas, and many other geographic units including small area units like zip codes and Census tracts. For more ACS info see http://www.census.gov/acs/www/. Other links include the U.S. Census Bureau, at http://www.census.gov, and American FactFinder, http://factfinder.census.gov/.
The Census Bureau also carries out the Building Permits Survey (BPS) we use for our housing supply proxy. The BPS is based on voluntary monthly and annual mail/internet surveys of the 20,000 local permit-issuing jurisdictions in the U.S., and tracks the number of new privately-owned structures authorized by building or zoning permits. See https://www.census.gov/construction/bps/.
Readers of this blog will be interested to learn that basic data collection like the ACS and BPS is under recurrent threat from budget cutbacks; these short-sighted reductions save negligible money but threaten not only academic research but also our regular practical work in real estate market analysis and the like. The American Enterprise Institute and Brookings Institution have jointly published a useful guide to Federal data sources and their cost-benefit.
References and Further Reading
Ambrosius, Joshua D, John I Gilderbloom, William J Steele, Wesley L Meares, and Dennis Keating. “Forty Years of Rent Control: Reexamining New Jersey’s Moderate Local Policies after the Great Recession.” Cities 49, (2015): 121-133.
Arnott, Richard. “Time for Revisionism on Rent Control?” The Journal of Economic Perspectives 9, no. 1 (1995): 99-120.
Asquith, Brian James. “Rent Control and Evictions: Evidence from San Francisco.” In 2016 Fall Conference: The Role of Research in Making Government More Effective: Appam, 2016.
Autor, David H, Christopher J Palmer, and Parag A Pathak. “Housing Market Spillovers: Evidence from the End of Rent Control in Cambridge, Massachusetts.” Journal of Political Economy 122, no. 3 (2014): 661-717.
Block, Walter, and Edgar Olsen. “Rent Control: Myths and Realities.” Vancouver: The Fraser Institute, (1981).
Early, Dirk W. “Rent Control, Rental Housing Supply, and the Distribution of Tenant Benefits.” Journal of Urban Economics 48, no. 2 (2000): 185-204.
Fetter, Daniel K. “The Home Front: Rent Control and the Rapid Wartime Increase in Home Ownership.” The Journal of Economic History 76, no. 4 (2016): 1001-1043.
Friedman, Milton, and George Joseph Stigler. Roofs or Ceilings?: The Current Housing Problem: Foundation for Economic Education Irvington-on-Hudson, NY, 1946.
Gyourko, Joseph, and Peter Linneman. “Equity and Efficiency Aspects of Rent Control: An Empirical Study of New York City.” Journal of Urban Economics 26, no. 1 (1989): 54-74.
Krugman, Paul. “Reckonings; a Rent Affair.” The New York Times, June 7, 2000 2000.
Landlord.com. “Residential Rent Control Law Guide by State.” 2014.
Malpezzi, Stephen. “Housing Prices, Externalities, and Regulation in U.S. Metropolitan Areas.” Journal of Housing Research 7, no. 2 (1996): 209-41.
Malpezzi, Stephen, and Gwendolyn Ball. Rent Control in Developing Countries. World Bank Discussion Papers, no. 129. Washington, D.C.: World Bank, 1991.
Malpezzi, Stephen, Henry O Pollakowski, and Tammie X Simmons-Mosley. “The Distribution of Rent Changes within a Market, and Implications for Second-Generation Rent Control.” Unpublished Manuscript. University of Wisconsin, (2005).
National Multifamily Housing Council. “Rent Control Laws by State.” 2017.
New Jersey Department of Community Affairs. “2009 Rent Control Survey.” Division of Codes and Standards, Landlord-Tenant Information Service, 2009.
Olsen, Edgar O. “An Econometric Analysis of Rent Control.” The Journal of Political Economy 80, no. 6 (1972): 1081-1100.
________. “What Do Economists Know About the Effect of Rent Control on Housing Maintenance?” The Journal of Real Estate Finance and Economics 1, no. 3 (1988): 295-307.
Pollakowski, Henry O. “Rent Control and Housing Investment: Evidence from Deregulation in Cambridge, Massachusetts.” Center for Civic Innovation at the Manhattan Institute, New York, NY (USA), (2003).
Regional Plan Association. “Pushed Out: Housing Displacement in an Unaffordable Region.” New York, NY; Princeton, NJ; Stamford, CT, 2017.
Rydell, C Peter, C Lance Barnett, Carol E Hillestad, Michael P Murray, Kevin Neels, and Robert H Sims. The Impact of Rent Control on the Los Angeles Housing Market: Rand Corporation Santa Monica, CA, 1981.
Schneider, Stephen A, Paul Bourquin, Stephen Malpezzi, and Lisa Johnson. “The Likely Impacts of Rent De-Control on District of Columbia Residents.” Arlington, VA: Nathan Associates, Inc., 2000.
Turner, Bengt, and Stephen Malpezzi. “A Review of Empirical Evidence on the Costs and Benefits of Rent Control.” Swedish Economic Policy Review 10, no. 1 (2003): 11-60.
Werness, Val. “Rent Controls: A White Paper Report.” National Association of Realtors, 2016.
Wiltz, Teresa. “As Rent Skyrockets, More Cities Look to Cap It.” The Pew Charitable Trusts/Stateline, 2015.
Yi, Karen. “Affordable Housing Settlements Spur Housing-Seekers’ Interest.” Newark Star-Ledger, December 6, 2016 2016.
________. “Advocates Push for Housing Affordability, Rent Control in a Changing Newark.” Newark Star-Ledger, February 16, 2017 2017.