Fears of rising inflation are rattling the markets. How real are they?
Markets have had a rambunctious start to the year. One of the narratives that has spread from the financial press that obsesses over every wiggle to the mainstream press is that rising inflation is one culprit driving bond yields higher and rattling the stock market. We take a detailed look at inflation dynamics and conclude that fears of surging inflation are likely overdone. Inflation hasn’t risen noticeably to date, a flexible oil industry is likely to keep a cap on energy prices, there are no evident signs of wage pressures despite a tight labor market, and technology will likely be an ongoing headwind to higher prices. While inflation does not appear poised to break out to the upside, wage growth and inflation are likely to be on a gradual upward trajectory in light of the strong economy, allowing the Fed to continue raising short-term interest rates, and longer-term bond yields may continue to rise because of widening fiscal deficits.
Is Inflation Spiraling Out of Control?
The month release of the Consumer Price Index is usually of interest only to economic geeks, bond traders, and Federal Reserve policy makers. However, the January report released in mid-February was met with breathless anticipation. Even the popular press was stirring up the fervor. USA Today’s headline ahead of the report read “Inflation Report Takes Spotlight Amid Market Plunge” and, after the release, delivered on the hype by showing inflation rising more than expected. The Washington Post posed the question “Inflation Today, Tomorrow Crisis?”
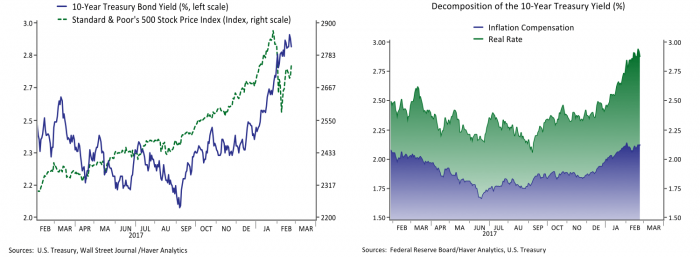
Rising bond yields are one reason for the increased focus on inflation. Bond yields can be decomposed into compensation for expected inflation and a real return component. The left panel of Figure 1 confirms that rising bond yields were seemingly one factor that contributed to the recent stock market correction. Both interest rates and stock values started rising in December on passage of the Tax Cut and Jobs Act, and equity investors appeared to realize the stimulus may not just be a free lunch as yields continued to rise to levels not seen since 2014. However the right panel illustrates that investor expectations of inflation over the next ten years has only nudged modestly higher, with the bulk of the rise in bond yields reflecting real interest rates.
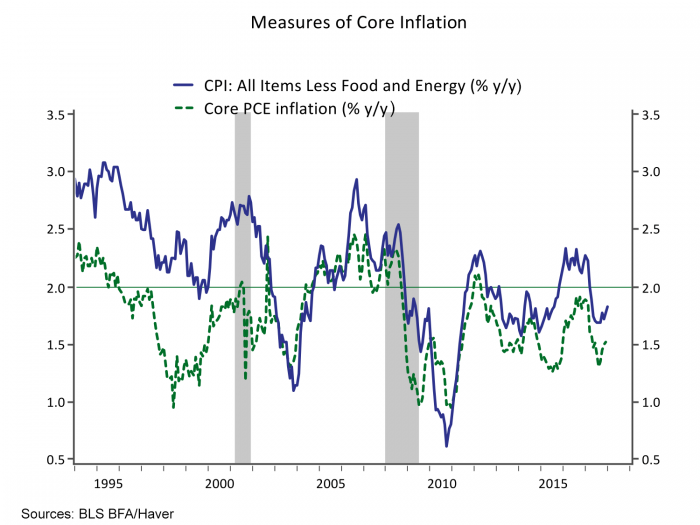
One reason investors don’t appear to be freaking out about inflation is that it isn’t really accelerating. While the overall consumer price index rose a greater than expected 0.5% m/m in January and core inflation excluding food and energy rose a surprisingly strong 0.3% m/m, the monthly data are volatile. The January gain was only a little stronger than last January’s stronger than expected 0.3% gain, leaving the annual pace of core inflation at a still subdued 1.8% y/y, which translates into an even lower 1.5% y/y pace on the Fed’s preferred core Personal Consumption Expenditures (“PCE”) price index (Figure 1). The Fed’s stated objective is 2% core PCE inflation, and the persistent shortfall of inflation to their target has led them to stress repeatedly in official communications that their goal is symmetric and that they “would be concerned if inflation were running persistently above or below this objective.” One reason the Fed is eager to see inflation centered on 2% instead of 1.5% is it would allow them to raise rates a little more over the course of the cycle and therefore have more scope for stimulus in the next economic downturn. Any data that suggests inflation is heading in the right direction is therefore welcome news given where we have been stuck in recent years, and the Fed is unlikely to be quick to respond with more than the gradual path of rate hikes for now.
The New Landscape of Energy Supply Means Oil is No Threat to Inflation
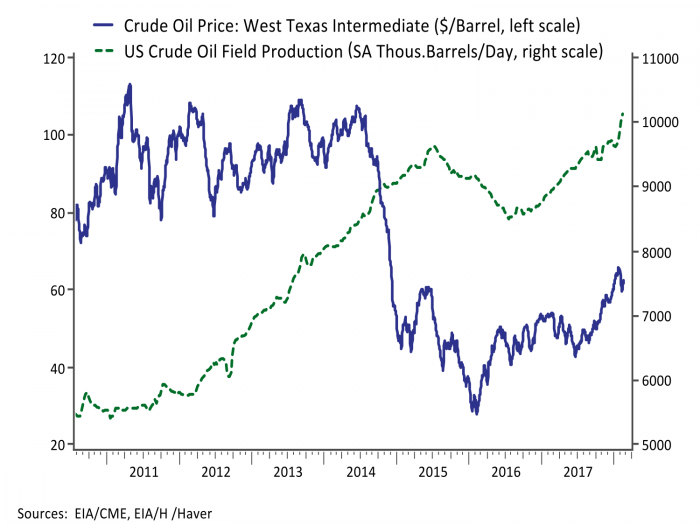
Oil and gasoline prices have been on the rise since the beginning of this year. Crude oil reached a more than three year high at more than $65 per barrel and gasoline prices rose more than 20 cents per gallon in January before moderating. Figure 3 shows US crude oil production and prices. The US energy revolution has meant that US energy production is growing faster than any other region or country in the world and is projected to continue expanding in coming years. US production is highly responsive to prices and, consequently, picked up early in the year. With the US serving as the independent, flexible marginal supplier, energy prices are likely to remain range bound. Crude oil prices below $40 per barrel lead to moderate production and prices above $60 produce an acceleration in production. This cap is reflected in current futures prices for crude oil; while the spot price settled at $63.55 per barrel at the end of last week, the futures contract for six months from now settled at $61.61 and the contract for twelve months forward settled at $58.86.
No Sign of a Wage Price Spiral
The workhorse model for understanding inflation is the Phillips Curve, a simple inverse empirical relationship between unemployment and wages observed by economist William Phillips in a paper published in 1958. The relationship between unemployment and consumer prices was popularized by Milton Friedman. The Phillips Curve hasn’t been particularly reliable in recent decades in predicting wages or prices, leading many to declare the Phillips Curve is flat, or even dead. Indeed it has been glaringly absent this cycle. Note in Figure 2 how inflation rebounded in 2010 even though the unemployment rate had barely budged from its peak at 10%, and then subsequently fell back with core PCE inflation averaging around 1.5% even as the unemployment rate has fallen to 4.1%, a level below what the Federal Reserve and Congressional Budget Office consider full employment.
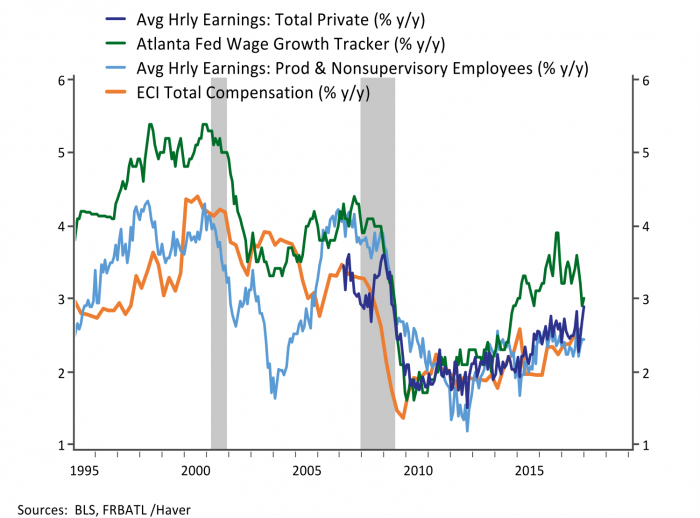
The labor market is running strong, and in terms of job creation, employers are reporting increased difficulty finding workers. Nonetheless the Fed noted in its semi-annual Monetary Policy Report to Congress that the unemployment rate considered to be full-employment is “inherently uncertain”, and any assessment of the tightness of the labor market must rely on wage growth since it is the price of labor. The Fed’s report noted that “the pace of wage gains has been moderate; while wage gains have likely been held down by the sluggish pace of productivity growth in recent years, serious labor shortages would probably bring about larger increases than have been observed thus far.” Figure 4 shows four of the most reliable gauges of wage growth, all of which point to a gradual upward trend but at a lower level and slower pace than observed in prior business cycles.
Another data point that garnered a lot of attention recently was a stronger than expected gain in average hourly earnings in the January employment report. The 0.3% monthly gain lifted the annual pace of average hourly earnings to 2.9% y/y, the strongest reading so far during the current recovery. Figure 4 puts that gain in context; wage growth remains lower and slower by any measure than in past cycles.
The Amazon Effect is a New Headwind to Inflation
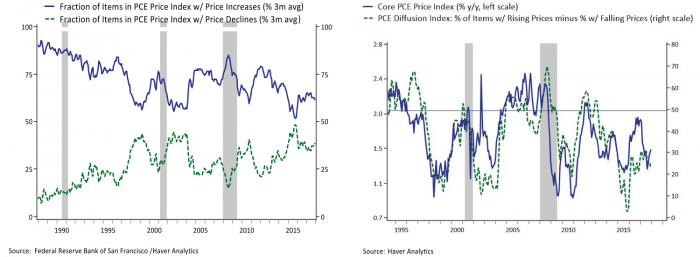
Disruption is the buzzword that has come to describe new firms that use technology to challenge existing business models. The common element across sectors is the use of technology to bring price transparency. Online shopping has disrupted retail, and smartphone apps have disrupted taxi transportation, hotel lodging, travel planning, music, and many other industries. One illustration of this in the left panel of Figure 5 is the fraction of items in the overall Personal Consumer Expenditure price index with rising prices versus the fraction with falling prices. There is an upward trend in the fraction of items being discounted that appears to be fairly acyclical. A diffusion index computed by taking the fraction of items increasing minus the fraction declining is plotted against the Fed’s target of core PCE inflation. The Figure suggests we don’t reliably hit 2% inflation until the diffusion index is close to 50, and the latest readings have been in the 20s. Ultimately industries should reach a new equilibrium where prices can’t be discounted further; however, we may not be there yet. Disruption continues to spread to new industries; an annual risk survey indicated that executives across industries ranked the rapid speed of disruptive innovation as one of their top five risks for the year for the first time, with the inability to optimize big data and the resistance of their organizations to change also included in the top ten. The spreading impact of price transparency associated with technology may be a headwind to inflation for some time.
The impact of technology on aggregate measures of inflation is a new frontier that is just starting to be analyzed and is still poorly understood. The Fed’s semi-annual report included a special section on “Low Inflation Across Advanced Economies” in which they noted that low inflation is a global phenomenon and that “the fact that many advanced economies are experiencing low inflation at the same time suggests that other, possibly more persistent, factors may be at work.” One factor they suspect may be at play is “technological changes could be reducing pricing power in many industries, holding down inflation as that occurs.”
There are few if any flashing red signals on inflation from the labor market, energy market or cyclical forces. Inflation may firm a little as 2018 unfolds, something that would be a welcome development for the Federal Reserve, allowing them to execute their plan for continued reduction of their balance sheet and three rate hikes. Such a scenario is well anticipated in current bond market pricing, suggesting it wouldn’t lead to further tightening in financial markets. That is not to say there aren’t risks, just that inflation is unlikely to be the boogeyman. As we wrote last week, a larger source of uncertainty is the untried experiment of injecting a large amount of fiscal stimulus into an economy near full employment. While we don’t expect this stimulus to translate into a spike in inflation, longer term bond yields may rise anyway as investors absorb a rising supply of government debt.
