
International comparisons of mortgage markets, part II
In a previous post, we discussed why finance in general is so important, especially for the smooth functioning of real estate markets. We also discussed, briefly, how financial markets gone wrong can lead to disaster. The previous post also put some numbers on what every reader already knows qualitatively – that countries exhibit enormous variation in their level of economic development, and the path they took to get where they are today. Real Gross Domestic Product per capita was our basic metric. There are at least a dozen more interesting measures if space permitted, but GDP is a great place to start.
Today we begin with just one more indicator, one that’s closely related to the health of the mortgage market: housing prices. After that final preliminary is out of the way, we will dive into some of the details of mortgage systems around the world. In two weeks, our final post in this series will examine how different measures of mortgage activity correlate with different housing market outcomes.
“What Lies Beneath:” Housing Prices
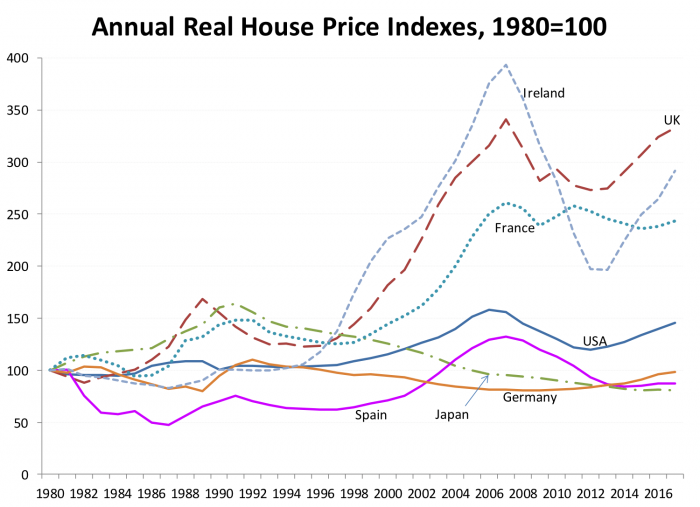
Exhibit 1
Exhibit 1 demonstrates that countries vary substantially in the performance of their housing markets, the underlying asset for mortgages. Exhibit 1 presents real house price indexes for seven countries not chosen at random to illustrate that, similar to GDP, house price experiences can be very different across countries.
These data are compiled by the Federal Reserve Bank of Dallas. The U.S. price indexes are based on Federal Housing Finance Agency (“FHFA”) repeat sales indexes adjusted for background inflation. Data for the other six countries replicate FHFA’s methodology insofar as possible. (See also the International Monetary Fund’s Global Housing Watch for another great source of comparative data.)
Notice that the U.S. index shows the 2000 era boom and bust; but said boom and said bust were modest compared to the experience of the UK or France or especially Ireland. The U.S. FHFA data show a real boom of about 4.2 percent per annum from 1996 to 2006, followed by a bust of about 4.5 percent per annum over the next five years. Other data, such as the familiar Case-Shiller price indexes (not shown), suggest an even faster U.S. boom averaging about 7 percent per year in the run-up, and a similar bust later. Now, a decade after, real house prices are at or near their 2006 peak in many U.S. markets.
Two caveats. First, the data for the seven countries in Exhibit 1 are national averages, and of course a number of individual markets within countries had much bigger booms and busts than show up in any national average. Compare the experience in a number of California markets with most southern and Midwestern markets, for example. This is also true elsewhere. Paris and London are much more volatile than other regions of their respective countries, for instance.
Second, the choice of starting point – 1980 – is somewhat arbitrary, and it does affect results somewhat. If we picked, say, 2000 as a starting point, Ireland’s boom and bust would moderate a bit, and Spain would show a bigger boom. Nevertheless, the examples shown here are sufficient to show the large variation in house price volatility across countries.
Whether we use the FHFA 4 percent U.S. rate of boom, or the Case-Shiller 7 percent, Ireland’s real house price boom was even larger. With the data collected from national sources by the Dallas Fed, Ireland clocks in at 11.5 percent per annum over a dozen years; the bust was 5 years of 13 percent per annum decline. But for the four years between 2012 and 2016, Ireland is off to the races again, with an annual growth rate of 10.3 percent.
France’s boom lasted from 1998 to 2007, 9 years of 8.3 percent growth, but without much of a bust – so far. The UK boomed (8.6 percent for 9 years) “busted” (–9.2 percent for 2 years), then grew at a strong but more sustainable rate of 2.4 percent.
Comparative research such as Cerutti, Dagher and Dell’Ariccia shows that these differences are to some degree related to the details of mortgage markets, and perhaps even more to do with land use and development regulation and other supply constraints, combined with more direct demand pressure from incomes and demographic shifts. Readers of our previous posts on the subject in the U.S. context won’t be surprised; Barker, Cheshire and Sheppard, Malpezzi and Mayo and especially Bertaud provide details and examples that extend those discussions to a range of other countries.
However, a stringent regulatory environment, or a different difficult geography, won’t generate a boom if there is no demand pressure as Malpezzi and Wachter, and Wheaton have shown. Japan’s 1980s bubble economy was followed by a nearly 3 decade bust. Despite a blip circa 1990, Germany famously never had a boom or a bust. We will argue below that some of the differences in housing market behavior are due to different rules of the game for housing finance.
Germany aside, the Urban Institute/Marron Institute’s Robert Buckley points out that a number of the European countries often had “bigger bubbles and less trouble.” It goes back to a distinction from the classic study by Reinhart and Rogoff between economies going into recession and house price declines because of changes in interest rates, versus the much more serious problems that come from deeper fundamental problems in credit markets.
It seems we can’t put off discussing what these credit markets are like, what the rules are, and some of their effects, any longer.
Taxonomy of Mortgage Instruments and Systems
Our discussion of instruments and systems is necessarily simplified, sometimes simplistic; consult Green, and many of the references below, for much more detailed discussion.
The term “mortgage” is itself borrowed from the French: mort, death or dying, and gage, a pledge. Hence a mortgage is a dying pledge, i.e. a pledge of payments that eventually pay themselves off.
Mortgages are collateralized loans, i.e. the loan is secured by the house or other real estate. Should the borrower default, eventually the lender can recover the property to satisfy remaining payments. Nonrecourse mortgages – legally required in some states for residential lending in the U.S. – limit the borrower’s ultimate liability to the mortgaged property. Recourse loans are those in which lenders can pursue other assets, garnish wages, and seek other payments if the value of the property itself is not sufficient to satisfy the loan. Even in states where recourse is possible, there is variation in how aggressively courts and lenders pursue non-housing assets, as Ghent and Kudlyak discuss. Outside the U.S., recourse mortgages are almost the rule.
The Structure of Mortgage Instruments
Mortgages vary by payment structure. Consider amortization. The familiar fully amortizing standard fixed rate mortgage is completely paid off – the gage is truly mort – at the end of the loan term. Or mortgages can be partially amortizing (“balloons”): when the term ends, some principal is due. This feature adds refinancing risk. Interest-only loans are riskier still, because “owners” don’t build up equity over time. Zero-coupon mortgages and variations like option ARMs/”pick-a-payment” are the riskiest of all, because equity erodes over time. Instead of paying all the periodic interest, these loans allow some or all of it to accrue, and the principal grows over time.
What rate of interest will be paid, and will that rate change over the life of the loan? Fixed rate mortgages are currently by far the most common in the United States; but as we saw in our recent post, during periods of high inflation and nominal interest rates, adjustable rate mortgages (ARMs, also known as variable-rate mortgages/VRM’s, or floating rate mortgages) become significant parts of the market. If interest rates begin to rise substantially we can expect to see these instruments again claim a larger share of the market.
When considering an ARM, there are many design features to consider. What’s the index we benchmark against? Prime rate? LIBOR? T-Bill or T-Bond rates? All have been used in the past, though Treasuries are most common today. How often do we permit rate adjustments? Quarterly? Annually? Are there limits or caps on interest rate increases? Do any caps operate over a given year? Others may operate over the life of a loan. Are there “teasers,” initial fixed low rates that change to a higher and more adjustable rate after some initial period (two years?)
Even these myriad design choices don’t exhaust the possibilities. One can index the price level of the mortgage balance itself, so-called PLAMs or price level adjusted mortgages. More complex instruments include shared equity appreciation mortgages, which offer borrowers a lower rate in return for sharing equity with the lender over time. The best starting point for understanding instrument design remains a classic Boston Fed conference volume edited by Modigliani and Lessard some four decades ago when U.S. financial regulators, faced with volatile inflation and a resultant mortgage market crisis, permitted a move away from the then-standard 30-year fixed rate mortgage to a broader menu of alternative mortgage designs.
Since inflation has been low and stable since the Great Financial Crisis, the 30-year fully amortizing fixed-rate mortgage is currently predominant in the United States, but generally unavailable in other countries, although some countries have some instruments that have either long terms or fixed rates, if rarely the entire package. For example, in Canada the standard instrument is a 5-year mortgage that is fixed for that period but rolls over – at a new rate – into a new mortgage more or less automatically and the end of the term. France and Denmark have versions of fixed-rate mortgages, but these are more often on the order of 20 years. Shorter terms than the U.S. ARMs are the rule in the United Kingdom, Australia, Italy, Portugal, Spain and Greece, among others. And of course, mortgages in all those countries are generally recourse.
In U.S. residential mortgages, it’s common to prepay and refinance when interest rates fall. Thus, a fixed-rate residential mortgage is a “one-way bet.” U.S. commercial mortgages, on the other hand, often contain impediments to prepayment/refinancing, such as lock-out provisions that prohibit repayment prior to maturity; or yield maintenance agreement, permitting prepayment only after paying a premium, which depends upon how much rates have fallen, and the length of the remaining yield maintenance period.
Another fundamental characterization of a mortgage is the degree of leverage, what Americans call loan-to-value (LTV) and some other countries call the gearing ratio. Higher LTV loans increase potential returns to buying a home, but also potential losses. A plethora of careful research papers have suggested that increases in LTVs played a significant role in the Great Financial Crisis. For example, Corbae and Quintin point out that among purchase loans insured by the FHA, Fannie Mae and Freddie Mac, the fraction of originations with cumulative leverage in excess of 97 percent of the home value was under 5 percent in 1990 but rose to almost 40 percent in 2007. Corbae and Quintin’s model suggests that the increased number of high leverage loans originated prior to the Great Financial Crisis can explain about 60 percent of the rise in foreclosure rates during the Great Financial Crisis.
Other countries vary in their leverage. Mortgage loans in the U.S. are commonly made at 75-80 percent LTVs; at the 80 percent threshold, fairly expensive mortgage insurance is normally required. But loans up to 97 percent LTV are regularly made. In fact, as of this writing GSEs and FHA are again aggressively marketing 3 percent down mortgages. What could possibly go wrong? Countries like Denmark, Germany, Italy, Japan, Korea, and Australia generally limit the LTV to 80 percent or less. France, Spain, the Netherlands and the United Kingdom permit 100 percent LTV loans, but with recourse, it’s borrower beware.
The 1970s spike in U.S. inflation and interest rates, and the resulting Savings and Loan crisis put an end to the “It’s a Wonderful Life” world of 30-year fixed-rate mortgages financed by depository institutions serving as one-stop shops for mortgage origination, servicing, and funding. Regulators began to permit a wide range of alternative mortgage designs. Circa 1980 many of us thought that the new world of adjustable-rate mortgages would settle down on a handful of standardized designs, but we couldn’t have been more mistaken. Literally hundreds of alternative designs using various indexes, spreads, caps, teasers, and every other element of design were in the market within a few years; thousands have appeared since. This creates a strange form of the asymmetric information problem. Borrowers don’t understand many of these instruments – and frankly, neither do most lenders. Instead of the classic restatement of asymmetric information “I know something you don’t know,” in this case it’s closer to “nobody knows anything.”
Just as developing countries can range from Liberia or Laos, to Botswana or China, ARMs can vary so much that the label can obscure as much as it reveals. I can design an adjustable-rate mortgage with a relatively stable benchmark rate, slow adjustments, and lots of caps that approximates the behavior of a fixed-rate mortgage. Or I can design something else entirely.
Of course, the mortgage system is much more than originators hawking mortgages of various designs. Mortgages are often insured to spread, and sometimes subsidize and/or socialize, the risk investors take in funding mortgages. Insurance generally covers some or all of the credit risk, i.e. timely payment of interest and principal against borrower defaults. Generally, insurance as such is not written against prepayment risk. In the U.S. credit risks can be insured by entities either public (FHA), private (MGIC), or something in between. Fannie Mae and Freddie Mac have long been major players in this market, but since the Great Financial Crisis insure roughly 90 percent of the market. These two Government Sponsored Enterprises (GSEs) were not quite public nor private. However, in 2008 when they entered conservatorship, they were taken over by the government. The GSEs insure credit risk but in turn they do generally require higher LTV loans to also carry some private insurance covering the top portion. They also sometimes sell securities to lay off their exposure.
Where Does the Money Come From?
Another broad categorization of national mortgage markets is by sources of funds. In some countries, government provides mortgage money directly to selected borrowers. These can be through “normal” budgetary processes, but mandatory savings systems (broadly similar to our Social Security system) are sometimes used. Singapore’s Provident Fund, which provides both pensions and a large fraction of that country’s mortgage finance, is an oft-cited example. China is among several countries that have adopted versions of the Provident Fund model. Of course, it’s possible to design a system that trades off contractual payments in early stages of life cycle for a relatively low-cost mortgage later, but which is voluntary and outside a social security or Provident Fund system. Such contractual saving systems have been used in Europe since World War II, including Germany’s Bauspar system and the French éparne-logement (Lea and Renaud).
Globally, most mortgage funding is private. The broadest division of private funding is between depositary systems (banks, savings and loans, building societies, credit unions) versus capital markets (mortgage backed bonds, pass through securities, etc.)
In the olden days of “It’s A Wonderful Life” world,” the U.S. was largely a deposit-based system; but by a few decades after the S&L crisis, we had moved more to a capital market system.
Countries which are largely bank financed today include Canada, the United Kingdom, Ireland and Italy. Green points out these tend to be countries where variable-rate mortgages predominate, so that the risks of funding with short-term deposits is largely borne by the borrower, and manageable to the financial institutions. Countries that rely more on fixed-rate mortgages like the U.S., Denmark and Germany are more often funded by capital markets. These capital market systems provide more ways to structure sources of funds to manage term risk, although the 2008 run on the U.S. short-term repo market “bank” for mortgage funds showed how this can go wrong, too.
Denmark is often cited as an early adapter of capital market funding for mortgages. In fact, Denmark’s system goes back to Copenhagen’s Great Fire of 1795, when much of the city needed to be rebuilt, and hence financed. In addition, Denmark is often studied because of its use of so-called covered bonds. To understand covered bonds, we’ll begin by briefly describing its cousin, better known in the U.S. as securitization.
In the U.S., most mortgages are securitized, using one of two basic methods. Pass-through securities are those where each security’s yield is comprised of its pro rata share of mortgage payments, including any acceleration from prepayments, or losses from defaults. Mortgage-backed securities (MBS) are instruments where the cash flows are tranched, such that the higher levels (AAA rated) paper receive a steady stream of income, while any cash flow variations from defaults and prepayments are absorbed by the lower tranches in a predefined order. Of course, if markets turn sufficiently sour or so bad that the lower-rated tranches disappear, losses begin to be shifted up to higher-rated tranches.
Large and complex markets of derivative securities based on these lower tranches appeared in the 2000’s, including so-called collateralized debt obligations (CDOs). CDOs facilitated the repackaging of lower rated (riskier) tranches into another round of securities that were claimed to create more AAA paper out of tranched cash flows from lower rated paper. These AAA trances were predicated on rating agency models that relied on a diversity concept in the pool. Well, they succeeded in creating lots of AAA rated paper, which is, as we learned, not quite the same thing.
Many variations on the CDO theme appeared, including synthetic CDOs that mirror their design but don’t actually fund mortgages directly, and CDO squared which (you guessed it) repackaged the riskier cash flows from the first round of CDOs, among others. See Green for elaboration. As an aside, the majority of losses in the Great Financial Crisis were in the lower tranches of the derivative securities and the fake AAA paper created from the CDO process, with few losses in the real AAA paper from the original MBS. Presently, post Great Financial Crisis, most financial flows to housing are through simple pass-through securities rather than tranched derivatives.
A system based on covered bonds, like the Danish system, works differently. In the securitization system above, the holders of the securities – pass-throughs or MBS – may and often do have some insurance from either public or private sources. These are limited to the original MBS, not the derivative securities, and they don’t cover all risks. In a securitized market, recourse is against collateral. In the end, the issuer may only be liable for such insurance or guarantees they may choose to offer. But covered bonds remain full obligations of the issuer. The investor in covered bonds thus has recourse to both the collateral and the issuer.
In the aftermath of the U.S. Great Financial Crisis, some looked to covered bonds as a possible “silver bullet” replacement for securitization. While covered bonds may have some advantages, it’s hard to see them as silver bullets. Who issues them? How strong is the issuer’s balance sheet, especially if they issue a lot of the securities? If issued by banks, how do we deal with a large number of covered bonds ranked ahead of depositors? Carbo-Valverde, Rodriguez-Fernandez and Rosen examine these issues in greater detail and conclude that, in the end, covered bond and mortgage-backed securities have different advantages and disadvantages. Neither system clearly dominates the other in terms of overall effectiveness.
Sources, and Further Reading
Barker, Kate. “Planning Policy, Planning Practice, and Housing Supply.” Oxford Review of Economic Policy 24, no. 1 (2008): 34-49.
Ben-Shahar, Danny, Charles Ka Yui Leung, and Seow Eng Ong. Mortgage Markets Worldwide. Blackwell Publishing, 2008.
Bertaud, Alain. Order without Design. MIT Press, Forthcoming.
Buckley, Robert M. Housing Finance in Developing Countries. Palgrave Macmillan, 1997.
Campbell, John Y. “Mortgage Market Design.” Review of Finance 17, no. 1 (2012): 1-33.
Carbó-Valverde, Santiago, Francisco Rodriguez-Fernandez, and Richard J Rosen. “Are Covered Bonds a Substitute for Mortgage-Backed Securities?”. (2013).
Centre for Affordable Housing Finance in Africa. “Housing Finance in Africa.” 2016.
Cerutti, Eugenio, Jihad Dagher, and Giovanni Dell’Ariccia. “Housing Finance and Real-Estate Booms: A Cross-Country Perspective.” Journal of Housing Economics (2017).
Chen, Jie, and Lan Deng. “Financing Affordable Housing through Compulsory Saving: The Two-Decade Experience of Housing Provident Fund in China.” Housing Studies 29, no. 7 (2014): 937-58.
Cheshire, Paul, and Stephen Sheppard. “Land Markets and Land Market Regulation: Progress Towards Understanding.” Regional Science and Urban Economics 34, no. 6 (2004): 619-37.
Chiquier, Loic, and Michael Lea, eds. Housing Finance Policy in Emerging Markets: World Bank, 2009.
Congressional Research Service. “Mortgage Markets in Selected Developed Countries.” Washington, DC, 2010.
Corbae, Dean, and Erwan Quintin. “Leverage and the Foreclosure Crisis.” Journal of Political Economy 123, no. 1 (2015): 1-65.
Deng, Yongheng, and Peng Fei. “The Emerging Mortgage Markets in China.” In Mortgage Markets Worldwide, edited by Danny Ben-Shahar, Charles Ka Yui Leung and Seow Eng Ong, 1-33: Blackwell, 2008.
Ghent, Andra C, and Marianna Kudlyak. “Recourse and Residential Mortgage Default: Evidence from Us States.” Review of Financial Studies 24, no. 9 (2011): 3139-86.
Green, Richard K. Introduction to Mortgages & Mortgage Backed Securities. Academic Press, 2013.
Green, Richard K., and Susan M. Wachter. “The American Mortgage in Historical and International Context.” Journal of Economic Perspectives 19, no. 4 (2005): 93-114.
Harris, Ron, and Asher Meir. “Recourse Structure of Mortgages: A Comparison between the U.S. and Europe.” DICE Report 13, no. 4 (2015): 15.
Hilber, Christian AL, and Wouter Vermeulen. “The Impact of Supply Constraints on House Prices in England.” The Economic Journal 126, no. 591 (2016): 358-405.
Hoek-Smit, Marja C (Executive Director). “Housing Finance Information Network.” http://www.hofinet.org/index.aspx.
Holly, Sean, M Hashem Pesaran, and Takashi Yamagata. “The Spatial and Temporal Diffusion of House Prices in the UK.” Journal of Urban Economics 69, no. 1 (2011): 2-23.
Lea, Michael J. “International Comparison of Mortgage Product Offerings.” Research Institute for Housing America, 2010.
Lea, Michael J, and Bertrand M Renaud. “Contractual Savings for Housing: How Suitable Are They for Transitional Economies?” World Bank Policy Research Working Paper, 1995.
Loungani, Prakash, and Hites Ahir. “International Monetary Fund Global Housing Watch.” http://www.imf.org/external/research/housing/index.htm.
Lunde, Jens, and Christine Whitehead, eds. Milestones in European Housing Finance. John Wiley & Sons, 2016.
Mack, Adrienne, Enrique Martínez-García, and Valerie Grossman. “A Cross-Country Quarterly Database of Real House Prices: A Methodological Note.” In Globalization and Monetary Policy Institute Working Paper: Federal Reserve Bank of Dallas, 2018.
Malpezzi, Stephen. “Residential Real Estate in the U.S. Financial Crisis, the Great Recession, and Their Aftermath.” Taiwan Economic Review 45, no. 1 (2017): 5-56.
———. “The Savings and Loan Crisis of the 1980s: Prequel to the Great Financial Crisis.” Wisconsin School of Business, Lecture Notes, 2016.
Malpezzi, Stephen, and Stephen K. Mayo. “Getting Housing Incentives Right: A Case Study of the Effects of Regulation, Taxes, and Subsidies on Housing Supply in Malaysia.” Land Economics 73, no. 3 (August 1997): 372-91.
Malpezzi, Stephen, and Susan M. Wachter. “The Role of Speculation in Real Estate Cycles.” Journal of Real Estate Literature 13, no. 2 (2005): 143-64.
Man, Joyce Yanyun. China’s Housing Reform and Outcomes. Lincoln Institute of Land Policy Cambridge, MA, 2011.
Modigliani, Franco, and Donald R. Lessard, eds. New Mortgage Designs for an Inflationary Environment: Federal Reserve Bank of Boston, 1975.
Reinhart, Carmen M, and Kenneth Rogoff. This Time Is Different: Eight Centuries of Financial Folly. Princeton University Press, 2009.
Renaud, Bertrand. “Housing and Financial Institutions in Developing Countries.” World Bank Staff Working Paper 658 (1984).
Renaud, Bertrand M. “Mortgage Finance in Emerging Markets: Constraints and Feasible Development Paths.” In Danny Ben-Shahar, Charles Ka Yui Leung and Seow Eng Ong (eds.), Mortgage Markets Worldwide. Blackwell (2009): 253-88.
Stephens, Mark. “Globalisation and Housing Finance Systems in Advanced and Transition Economies.” Urban Studies 40, no. 5-6 (2003): 1011-26.
Warnock, VC, and FE Warnock. “Markets and Housing Finance.” Journal of Housing Economics 17, no. 3 (2008): 239-51.
Wheaton, William C. “Real Estate” Cycles”: Some Fundamentals.” Real Estate Economics 27, no. 2 (1999): 209-11.