
Photo Credit: Peter Funnell (gettyimages)
Will inclusionary zoning (IZ) help solve our affordability problems?
Executive Summary: A month ago we took a broad look at housing “affordability” at Rutgers’ BlogˑRE, and two weeks ago we examined one approach to tackling high housing costs, rent controls. We found that solution wanting: “Rent control is not, in general, an effective solution for housing affordability problems” was that blog post’s bottom line.
Today we’ll explore another oft-proposed solution to high housing costs, namely “inclusionary zoning.” In brief, inclusionary zoning (IZ) comprises some kind of rule that requires developers of market-rate housing to also provide some corresponding number or proportion of “affordable” units. Inclusionary zoning will be described in some detail below, but first let’s cite some of its proponents:
As the Tri-State Regional Plan Association prepares for its 2017 Fourth Regional Plan,
Solving the affordability crisis for residents with limited means will require aggressively preserving the low- and moderate-income housing that we already have and building more through inclusionary zoning and other means.
A recent review by New York City’s Department of City Planning argues:
Maintaining economically diverse neighborhoods and the availability of housing for New Yorkers at a range of income levels requires a multifaceted approach [including] establishment of a mandatory Inclusionary Housing program.
The nationally and globally recognized Lincoln Institute of Land Policy declares:
After decades of disinvestment, American Cities are rebounding, but new development is often driving housing costs higher and displacing lower-income residents. For cities struggling to maintain economic integration, inclusionary housing is one of the most promising strategies available to ensure that the benefits of development are shared widely.
The recent White House Housing Development Toolkit also calls for the use of inclusionary zoning as part of its package of suggested housing policy actions. These institutions are not alone in arguing for more widespread use of inclusionary zoning. For example, recently Newark has been moving towards approving a new and strengthened IZ law. In March 2016 New York City Council approved a strengthened, mandatory inclusionary housing program. In addition to mandating participation in the program, the revised New York City rules eliminate expiration dates for affordability requirements. These recent IZ rules can be reviewed for New York and New Jersey.
Our bottom line, is different. We will argue below that inclusionary zoning, a tax on housing capital, is often not very effective and can actually reduce affordability. The devil is again in the details; to cite the Lincoln Institute again:
To realize the full benefit of this approach, however, policies must be designed with care.
What Is Inclusionary Zoning?
Of course “inclusionary” and “zoning” is an interesting juxtaposition; often zoning, and other land use and development regulations have been exclusionary in nature, as New Jersey’s long history with the Mt Laurel cases and its progeny remind us (Fischel).
Inclusionary zoning, now often re-branded “inclusionary housing,” is an increasingly common response to perceived problems of housing affordability. To receive approval to develop “high cost” units, a developer agrees to develop some “low cost” units (or pay someone else to do so). This is, in effect, a tax on housing development, albeit one that is, at least in principle, earmarked for the construction of some lower cost units.
Often, participating developers are granted a “density bonus” or some other regulatory relief for their “high cost” units. This can be analyzed as a subsidy on housing development that partially offsets the IZ tax. So it’s immediately apparent that the details of the program matter, as well as other costs and benefits that accrue to developers from different government interventions.
IZ began decades ago, largely in California, which adopted enabling state legislation; and in New Jersey, partly in response to the Mt. Laurel court decisions requiring communities to permit their “fair share” of low cost housing. But now hundreds of jurisdictions around the country have taken up IZ, with more either taking it up or giving it serious consideration.
There are many different flavors of IZ. Inclusionary zoning programs can be either mandatory or voluntary. Is it a regional or local ordinance? How large must a market project be to trigger IZ rules? This can range from a single unit, as in Boulder, to 400 or more units in some larger markets. How many units must be set-aside as affordable? Reviews such as those by Vandell find this often ranges from 10-30 percent, with 15 percent a typical value. What’s the income ceiling for tenants? Reviews find limits of 30-80 percent of area median income, with 50 percent of AMI a common threshold.
There are many other questions to be answered, as Vandell points out. How are units allocated to households if there is excess demand? Are these rental or owner-occupied affordable units? How are rents, or prices, set? How long are rents/prices controlled? They can range from 10 years, to forever; 30 year restrictions seem to be the most common.
There are so many variations on the theme that there is not total agreement on what actually constitutes “inclusionary zoning” or “inclusionary housing,” versus other kinds of programs. In an example close to home, some students of IZ classify most of New Jersey’s “Fair Share” efforts as inclusionary, other papers do not. To further complicate things, housing programs are not always mutually exclusive. A particular project can be developed as part of the federal Section 42 Low Income Housing Tax Credit program, be part of a local IZ program, obtain local property tax abatements, and serve tenants who receive federal Housing Choice Vouchers, and so on. Housing analysts often call this “layering.”
Many inclusionary zoning programs focus on rental projects, but they can also be applied to owner-occupants. Homeowner-focused IZ programs are often similar in design to so-called community land trusts, programs where occupants are in a sort of in-between tenure (Voith and Wachter). Community land trusts are programs under which households “purchase” the housing unit but only temporarily; and land ownership is retained by the trust. When the household moves, they must sell back to the trust. There may be an appraisal but in any event the sale is not arms’ length, and there are complicated formulas for determining what, if any, capital gain may be retained by the former occupant.
It’s a slight exaggeration to refer to CLTs as programs that combine the wealth-building potential of renting and the high transactions costs of owning. For owner-occupied IZ units, what happens when they sell? Who buys the unit, who gets the capital gain?
Perhaps most importantly for some political actors, inclusionary zoning, like rent control, is off budget. It imposes costs, but they are hidden. It appears at first as if the costs are borne by developers. Of course any student of Econ 101 will immediately wonder how much of this cost is passed on to tenants. We’ll examine that issue in the next section.
This is only the start of a long list of questions about features, there’s an even longer and more difficult list about outcomes. For example, what are the costs and benefits of the associated density bonuses? What are the incomes of households in “affordable” units? Does IZ serve the poor, or lower-middle-income? What is the “transfer efficiency” or ratio between project costs, and actual benefits to participants? Does IZ affect racial or income integration? If we build a lot of IZ units, what happens to the filtering process in the rest of the market? What effect does IZ have on urban decentralization (“flight to the suburbs,” “sprawl?”) How does IZ affect the city’s tax base?
The Current State of Inclusionary Zoning
Inclusionary zoning reached one peak of popularity in the late 2000s, as the housing boom took hold. But many cities found the programs had little effect. For example, despite a large amount of council, staff and developer resources invested in Madison’s IZ program during that period, over 4 years 33 low cost units were produced, in a city of a quarter million residents; the program was later suspended (City of Madison 2008.)
Despite its many advocates, and a number of programs put in place, IZ does not seem to have had much of an effect on the total supply of housing. Freeman and Schuetz have just undertaken a nice review that puts IZ in perspective with other programs and with the overall housing stock; our Exhibit 1 is derived from the data presented in their Exhibit 2.
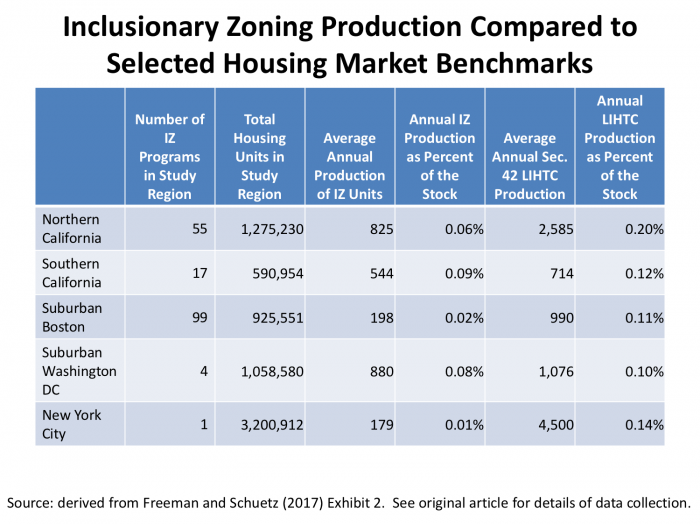
Exhibit 1
As Freeman and Schuetz note these are five regions in which inclusionary zoning is especially popular among local governments. Nevertheless, the bottom line from Exhibit 1 is that even under conditions of supportive governments, stringent regulations, and relatively hot housing markets under which there’d be incentive for developers to incur the costs of inclusionary zoning in order to develop market rate units, only a very few units seem to get developed.
Recently IZ has made a comeback, at least among some local governments and advocates, as the news items cited above suggest; and it is even one of the suggested actions in the White House’s recent Housing Development Toolkit. Jacobus (2015) presents some description of recent programs and advocacy, albeit with some sensible suggestions regarding the design of an IZ program, should one desire to undertake one. Jacobus also points out the lack of hard data that permits a more thorough evaluation of such programs.
Powell and Doherty (2015) collected reports on New Jersey’s affordable housing production from 1990 to 2010. The found that municipal plans submitted to the Council on Affordable Housing (COAH) allowed for 35,910 planned affordable units; 16,870 units were actually built. During that period, Census reports that total building permits actually issued in New Jersey (usually a little less than units finally built) came in at 543,893 units. So “affordable” units, so labeled, comprised roughly 3 percent of new construction in New Jersey.
Economic Evaluation of Inclusionary Zoning
The literature documents that there are hundreds of jurisdictions with inclusionary zoning rules, but we still have little systematic information, even basic data on how these programs are distributed nationally. This is clearly an area where consistent data collection at the national level would facilitate better analysis.
To date no one’s done a complete empirical economic analysis of inclusionary zoning programs, although a number of papers have tackled some element of the programs, sometimes through theory, sometimes through case studies.
Despite a paucity of detailed data on IZ, once we recognize that analytically it’s basically a tax on one kind of housing development that’s used to subsidize another, we can use basic supply and demand analysis and previous research on housing demand and supply responsiveness to analyze IZ. We present such a model below, as an appendix, so that interested readers can review the details. For those willing to accept our analysis on faith (at least until you get to the bottom of this blog entry), we find that probably 50 to 80 percent of the costs of “included” affordable units are actually paid by the consumers of market rate housing, as much of the costs are shifted forward. This is what legal scholar Robert Ellickson called “the irony of inclusionary Zoning.”
IZ can impose relatively large costs on individual developers and a particular project, which may or not be shifted to consumers of these new market rate projects. But if the size and number of projects is small relative to the entire existing stock, these effects may or may not be discernible when looking at market aggregated, e.g. the total amount of housing stock or production, or rents or prices.
The best evidence to date on such market effects to date comes from Schuetz, Meltzer and Been (2011). They carried out an empirical analysis of IZ Boston that estimated the overall size of price and production effects in San Francisco and Boston. In San Francisco, the program was in place over 25 years and IZ units comprised about 2 percent of units produced over the period. In Boston the program had been in place for a shorter period. Schuetz et al. found that Boston’s program appeared to increase prices and lower overall production, according to their econometric model; they found no statistically significant impact in San Francisco.
The implicit tax from inclusionary zoning can be offset at least in part by density bonuses and other regulatory relief, property tax limitations such as New York’s 421 program or other subsidies or grants to developers. This brings up a broader issue, that housing and real estate development are complex especially in the urban environments of the tri-state area. Governments at many different levels and even different agencies within a level simultaneously provide benefits to developers with one hand and impose cost with the other. It would be a useful applied research project to apply the incentives model developed for World Bank policy analysis to New Jersey (Baharoglu et al., Malpezzi and Mayo).
A recent RAND study of inclusionary zoning in 11 markets around the country focused on the potential benefits from improved access to quality K-12 education. Schwartz et al. focused mainly on IZ programs that were developed for owner-occupants. In general, they found that IZ programs were small relative to any measures of market or demand, as is already evident from data presented above. They also looked at incomes of participants and noted that these particular programs served below-average income households, but did not reach very far down into the income distribution. They conclude:
While IZ programs serve relatively more-advantaged families than other affordable housing programs generally do, the degrees of access IZ provides to low-poverty places is still remarkable. However in serving primarily homeowners, the IZ programs [studied] are not typically designed to serve households at the lowest income levels or those with extensive need for support….
The Bottom Line
Inclusionary zoning is much discussed of late, hundreds of municipalities have put programs in place, and many more are contemplating creating or strengthening such programs. But so far it’s hard to find much evidence that IZ has contributed significantly to solving housing costs issues; and given the potential for shifting costs from developers to consumers, it’s hard to see it as having a lot of potential.
There are of course many additional ways in which housing affordability can be attacked including statewide efforts such as New Jersey’s fair share programs in response to the Mount Laurel decisions; efforts to rationalize land use and development regulation that could lower costs; the section 42 low income housing tax credit program; and housing vouchers, just to name a few that we will discuss in future posts.
Optional Economist’s Geek-out: A Supply-Demand Analysis of Inclusionary Zoning
Above, we argued that inclusionary zoning could be analyzed as a tax on housing development in general. You can take our word for it – or you can read this optional section! For those who’d like a little practice extending their Econ 101 supply and demand analysis, here we work out a simple model that illustrates how IZ can have unintended consequences and reduce the supply of housing.
Our analysis will be simple, but will assume prior knowledge of how supply and demand curves work. For a review of supply and demand basics, there are plenty of books and online readings around or you can check out some videos, such as the excellent Marginal Revolution series.
In this exercise we will go a step beyond the most introductory supply and demand analysis to incorporate two related housing submarkets, as in Exhibit 1, below.
To make the model tractable – simple enough to graph in two panels – we deliberately oversimplify the real world. We imagine there is only one kind of newly built housing unit (a standard apartment of a given size) and only two kinds of households (low income and high income). Of course there are many kinds of both units and households, but this simplification or use of “Occam’s Razor” allows us insight into the qualitative forces at work, and rough magnitudes, which is sufficient for today’s purposes.
We will also assume that all the numerous actors on the supply side are combined into “landlord-developers” who are simultaneously landowners, developers, construction managers, and landlords, and who self-finance. Sometimes it can be interesting to separate the effects of a policy like inclusionary zoning on land markets, and developers, and landlords, perhaps even to debt and equity investors; but today we will ignore those questions and assume they’re all wrapped together.
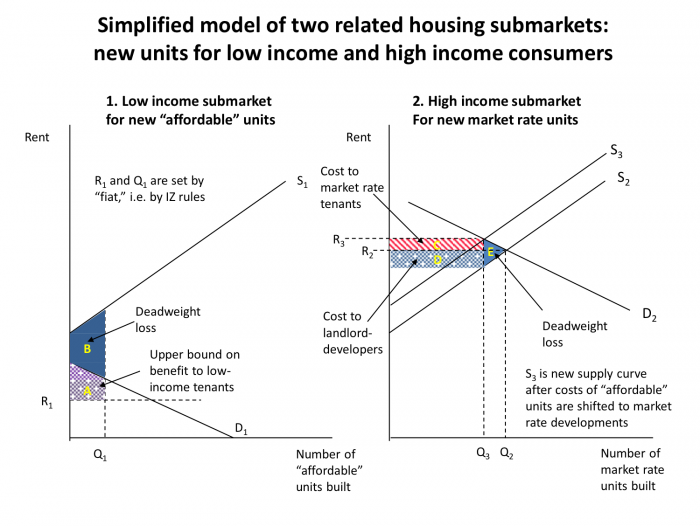
Exhibit 2
Using supply and demand analysis to examine IZ goes back at least to Ellickson (1980); our particular model most closely follows the structure and exposition in Allen (2002).
The left panel of Exhibit 1 shows the supply and demand for new housing units for low income renters. The right hand panel shows the submarket in the same city for new market rate units. Before we get into the weeds let’s note a few interesting things about these two panels.
First of all these two panels represent supply and demand figures for new housing in our highly simplified city. In any given year, 98 or 99 percent of the housing consumed in the city will come from the existing stock. Of course there is also a supply and demand for this existing stock, but that happens “offstage;” we won’t bother to draw that panel today.
Second, notice that the supply curves in both panels are similar. We assume for simplicity that there’s only one kind of housing unit. This allows us to measure the quantity of housing built by simply counting units.
Also, because all units are identical, changes in rents (the vertical axis) are also changes in true monthly prices: in housing economist jargon, “flow prices per unit of housing services.” Normally, rent is what we spend on housing, and to an economist that expenditure is not strictly a “price;” rather, rent is the product of the monthly (periodic or “flow”) price per unit of services, and the quantity of housing services delivered by a unit. If I pay $1500 and you pay $1000, my rent is higher; but if I’m getting double your square footage, and an extra bathroom, and granite counters compared to your Formica, and your AC is not working, well maybe I am actually paying a lower price!
But in today’s simple model, since all units are the same, we can ignore these complex measurement issues. (Occam’s Razor to the rescue, again!) The rent for a unit also represents the true monthly price of the unit under our simplifying assumptions, since the quantity of housing services delivered by each apartment is the same.
Now, with preliminaries out of the way, let’s focus on the operation of inclusionary zoning. The demand for housing is so low in Panel 1, the low-income new construction market, that given their lower income, without some government intervention such as a force majeure requirement that developers build some “affordable” units and target to them to low income households at below market rates, no new housing will be built for low income households. Instead, all low-income households will obtain their housing “offstage,” from the existing stock. Put another way, without government intervention, little if any new housing is ordinarily built for this market, because low-income consumers willingness and ability to pay, as shown by the low demand curve D1 in Panel 1, is less than the required rents developers have to charge to recover their costs and earn a normal rate of return, as reflected in their supply curve S1.
But if there’s a mandatory IZ program, there is exactly that force majeure requirement mentioned above. In the left panel the low income submarket for new affordable units, we’ve assume that government has determined that at current market conditions Q1 affordable units must be supplied by developers at a below-market rent R1.
At such a low rent a large number of households would be attracted to the units, but again only Q1 “affordable” units are available on the market. The quantity supplied Q1 is also set by fiat, that is by the inclusionary zoning regime rules, not by a market process. The lucky Q1 residents who obtain these affordable units not only pay a below-market rent, but also obtain consumer’s surplus equal to the area above the R1 line and below the demand curve, i.e. the purple dotted trapezoid labeled “A.”
In Panel 1, landlord-developers lose amounts equal to the area above the R1 line and below the supply curve S1, i.e. the pair of trapezoids labeled A and B. This loss to landlords comprises two parts. One part is the area A, also equal to the consumer surplus obtained by low income tenants. So area A is a transfer from the developer-landlord to the tenant. But the dark blue trapezoid labeled B is a loss to developers that doesn’t benefit the tenant or anyone. Area B is a pure deadweight loss.
What about the right hand side of Exhibit 2, Panel 2? That’s the market for new market rate housing, and we assume that the IZ program links the two panels, i.e. in order to build market rate housing, and play in Panel 2, you also have to build some “affordable” units, i.e. play in Panel 1.
Since landlord-developers lose money in the affordable market, equal to the pair of trapezoids A and B, that’s simply an additional cost they incur to build their market rate units in the right hand panel. Anytime you have an increase in developer costs, whether it’s from the price of construction or a new tax or in this case the requirements of an IZ program, whatever raises costs will shift market supply curves up and to the left. So the increase in costs from IZ in the left panel shifts the supply curve in the right-hand part panel from S2 to S3.
Given downward sloping demand curve D2, at the new higher costs the number of units built falls from Q2 to Q3, and market rents rise from R2 to R3 in order to cover these costs. As you recall from Econ101 there is a new deadweight loss which is the triangle to the right of Q3 and labeled “E.”
Who actually pays for the IZ program? This is determined by the two rectangles to the left of Q3, labeled “C” and “D.” As you probably recall from Econ 101, in general the additional cost of any tax represented by the vertical shift of the supply curve will be split between suppliers (here, landlord-developers) and consumers (here, tenants).
The full analysis of “the economic incidence of the IZ tax” goes as follows. Without an inclusionary zoning requirement, the market produces Q2 units at rent R2. With inclusionary zoning in place, the additional costs from inclusionary zoning shifts the supply curve up to S3. Thus market rate renters incur a total additional cost (R3 – R2)*Q3, or area “C.” But of course this is only part of the extra cost of producing Q3 units at the new higher supply curve; the landlord-developer pays the rest of the cost, represented by the rectangle rising from the marginal cost of the “Q3rd” unit, up to the original market rent R2; also known as area “D.”
Notice that as we pivot the supply curves around these points the route around the original equilibrium at R2 Q2, the rectangles C and D change. As we make supply curve steeper or more inelastic, the lower blue rectangle D gets larger; and the red rectangle C shrinks: landlords pay more, and tenants pay less. As we make the market more elastic, that is, as supply curves flatten, the landlord- developers pay less and the tenants pay more. In other words, the more competitive the market, the more the tax of IZ is shifted from developer-landlords to consumers.
Algebraically, the relative shares borne by consumers and producers can be shown to be equal to the inverse of the price elasticity of supply of housing divided by the price elasticity of demand (see for example Quigley and Smolenksy). Studies of local price elasticities by Green Malpezzi and Mayo, and by Saiz, find that New York and Newark supply elasticities might be on the order 0.8 to 1.2; more elastic markets like Bridgeport CT, Philadelphia and Syracuse are on the order of 4 or 5. Demand elasticities are much more stable and not especially dependent on location; reviews by Mayo and by Malpezzi and Wachter suggest demand elasticities might be on the order of .8 in magnitude.
This would mean that in relatively inelastic markets in the Tri-State area consumers and producers might split the costs of inclusionary zoning 50-50; in our more elastic markets the split might be as much as 80 percent paid ultimately by consumers and 20 percent by producers. Most of the cost of the inclusionary zoning units is thus passed on to the buyers of the market rate units, and makes the market rate units less affordable. This is what Ellickson referred to as “the irony of inclusionary zoning.”
Two other points need to be addressed briefly. First, how much do the extra costs actually shift up the supply curve in Panel 2? We’ve discussed the costs that IZ imposes on the developer-landlord, but an IZ program can also be designed that compensates developers to some degree, for example with density bonuses – higher allowable floor area ratios, ore reduction in impact fees, or property tax abatements, for example. These would require a smaller shift upwards from S2 to S3 to get back to normal profits. Or if the “affordable” units are lower quality/cost than the market rate units, the supply curve S1 could shift down. That depends on the details of the program of course. In theory one could completely offset or even over-compensate developers if sufficient subsidies and density bonuses were included.
And of course program details and market conditions matter. If the administratively set rent R1 rises, or the number or proportion of “affordable” units required, Q1, falls, the costs to developers is reduced. Suppose that the demand curve for lower-income households was actually higher than drawn in Exhibit 2; obviously that would reduce the deadweight loss of the program, but the total loss to developers would remain as large as before.
A second important point is that offstage, if filtering works quickly, new “affordable” units may lead to faster demolition of existing offstage existing affordable units. Research on filtering and the substitution effects between affordable projects and existing affordable housing by Murray, Malpezzi and Vandell, and Sinai and Waldfogel suggest these effects may be significant.
References and Further Reading
Allen, Andrew T. “Inclusionary Housing in San Diego: An Economic Analysis.” University of San Diego Real Estate Institute, 2002.
Anderson, Bendix. “More Cities Join Inclusionary Zoning Trend to Create Affordable Housing.” National Real Estate Investor, 2016.
Baharoglu, Deniz, Larry M Hannah, and Stephen Malpezzi. “Getting Housing Incentives Right in Turkey.” In International Meeting of the American Real Estate and Urban Economics Association. Los Angeles, 1997.
City of Madison, Wisconsin. “Inclusionary Zoning Annual Report.” 2008.
Dawkins, Casey, Jae Sik Jeon, and Gerrit-Jan Knaap. “Creating and Preserving Affordable Homeownership Opportunities Does Inclusionary Zoning Make Sense?” Journal of Planning Education and Research, (2016).
Ellickson, Robert C. “The Irony of Inclusionary Zoning.” Southern California Law Review 54, (1980): 1167.
Ellickson, Robert C. “The False Promise of the Mixed-Income Housing Project.” UCLA L. Rev. 57, (2010): 983-1819.
Fischel, William A. “Exclusionary Zoning and Growth Controls: A Comment on the Apa’s Endorsement of the Mount Laurel Doctrine.” Wash. UJ Urb. & Contemp. L. 40, (1991): 65.
Fischel, William A. “An Economic History of Zoning and a Cure for Its Exclusionary Effects.” Urban Studies 41, no. 2 (2004): 317.
Fisher, Lynn M, and Nicholas J Marantz. “Can State Law Combat Exclusionary Zoning? Evidence from Massachusetts.” Urban Studies 52, no. 6 (2015): 1071-1089.
Freeman, Lance, and Jenny Schuetz. “Producing Affordable Housing in Rising Markets: What Works?” Cityscape 19, no. 1 (2017): 217-236.
Green, Richard K., Stephen Malpezzi, and Stephen K. Mayo. “Metropolitan-Specific Estimates of the Price Elasticity of Supply of Housing, and Their Sources.” American Economic Review 95, no. 2 (2005): 334-39.
Gruen, Claude. “Getting Inclusionary Zoning Right.” Urban Land, August 3, 2016 2016.
Hickey, Robert, Lisa Sturtevant, and Emily Thaden. “Achieving Lasting Affordability through Inclusionary Housing.” Lincoln Institute of Land Policy, 2014.
Jacobus, Rick. Inclusionary Housing: Creating and Maintaining Equitable Communities: Lincoln Institute of Land Policy, 2015.
Jakabovics, Andrew, Lynn M Ross, Molly Simpson, and Michael Spotts. “Bending the Cost Curve: Solutions to Expand the Supply of Affordable Rentals.” Washington, DC: Urban Land Institute, 2014.
Kautz, Barbara Ehrlich. “In Defense of Inclusionary Zoning: Successfully Creating Affordable Housing.” USFL Rev. 36, (2001): 971.
Kirkham, Chris. “Los Angeles Builders Say New Affordable-Housing Rules Will Stifle Construction.” Wall Street Journal, November 17, 2016 2016.
Lerman, Brian R. “Mandatory Inclusionary Zoning-the Answer to the Affordable Housing Problem.” BC Envtl. Aff. L. Rev. 33, (2006): 383.
Malpezzi, Stephen, and Stephen K. Mayo. “Getting Housing Incentives Right: A Case Study of the Effects of Regulation, Taxes, and Subsidies on Housing Supply in Malaysia.” Land Economics 73, no. 3 (1997): 372-91.
Malpezzi, Stephen, and Kerry Vandell. “Does the Low-Income Housing Tax Credit Increase the Supply of Housing?” Journal of Housing Economics 11, no. 4 (2002): 360-80.
Malpezzi, Stephen, and Susan M. Wachter. “Housing Demand.” In International Encylopedia of Housing and Home, edited by Susan J Smith: Elsevier, 2012.
Mayo, Stephen K. “Theory and Estimation in the Economics of Housing Demand.” Journal of Urban Economics 10, no. 1 (1981): 95-116.
Meltzer, Rachel, and Jenny Schuetz. “What Drives the Diffusion of Inclusionary Zoning?” Journal of Policy Analysis and Management 29, no. 3 (2010): 578-602.
Mock, Brentin. “Inclusionary Zoning Does Not Drive up Housing Costs: New Research Shows That It Doesn’t Raise Housing Costs, but It Doesn’t Help Very Low-Income Families Much, Either.” The Atlantic/Citylab, June 1, 2016 2015.
Murray, Michael P. “Subsidized and Unsubsidized Housing Stocks 1935 to 1987: Crowding out and Cointegration.” The Journal of Real Estate Finance and Economics 18, no. 1 (1999): 107-124.
New York Department of City Planning. “Mandatory Inclusionary Housing: Promoting Economically Diverse Neighborhoods.” 2015.
NYU Furman Center. “Creating Affordable Housing out of Thin Air: The Economics of Mandatory Inclusionary Zoning in New York City.” 2015.
Powell, Robert S. Jr., and Gerald Doherty. “Demographic and Economic Constraints on the Inclusionary Zoning Strategy Utilized for the Production of Low and Moderate Income Housing in New Jersey.” New Jersey State League of Municipalities, 2015.
Quigley, John M, and Eugene Smolensky. Modern Public Finance. Second ed.: Harvard Univ Press, 2000.
Rosenthal, Stuart S. “Are Private Markets and Filtering a Viable Source of Low-Income Housing? Estimates from a Repeat Income Model.” American Economic Review 104, no. 2 (2014): 687-706.
Saiz, Albert. “On Local Housing Supply Elasticity.” Quarterly Journal of Economics, no. January (2008).
Schuetz, Jenny, Rachel Meltzer, and Vicki Been. “31 Flavors of Inclusionary Zoning: Comparing Policies from San Francisco, Washington, Dc, and Suburban Boston.” Journal of the American Planning Association 75, no. 4 (2009): 441-456.
________. “Silver Bullet or Trojan Horse? The Effects of Inclusionary Zoning on Local Housing Markets in the United States.” Urban Studies 48, no. 2 (2011): 297-329.
Schwartz, Heather L, Liisa Ecola, Kristin J Leuschner, and Aaron Kofner. “Is Inclusionary Zoning Inclusionary? A Guide for Practitioners. Technical Report.” RAND Corporation, (2012).
Sinai, Todd, and Joel Waldfogel. “Do Low-Income Housing Subsidies Increase the Occupied Housing Stock?” Journal of Public Economics 89, no. 11-12 (2005): 2137-2164.
Sturtevant, Lisa A. “Separating Fact from Fiction to Design Effective Inclusionary Housing Programs.” Washington, DC: Center for Housing Policy, (2016).
Vandell, Kerry D. “Inclusionary Zoning: Myths and Realities.” University of Wisconsin-Madison: Center for Urban Land Economics Research, 2003.
Voith, Richard, and Susan M Wachter. “The Affordability Challenge: Inclusionary Housing and Community Land Trusts in a Federal System.” Value Capture and Land Policies, Gregory K. Ingram and Yu-Hung Hong, eds., Lincoln Institute of Land Policy, (2012).
White House. “Housing Development Toolkit.” Washington, D.C., 2016.
Yi, Karen. “Development Vs. Displacement: How Newark Wants to Keep the Balance.” Newark Star-Ledger, February 2, 2017 2017.