Examining the risks of the having-your-cake-and-eating-it-too financial markets
The psychology of markets for risky assets of late has been to view everything through rose colored-glasses. One rosy source of support has been persistently low bond yields. However that source of support has been engineered to some degree by central bankers and political gridlock in recent years that produced ever smaller fiscal deficits. A shortage of Treasuries helped pin down longer-term interest rates. 2018 brings a marked shift in fiscal and monetary policy with a widening fiscal deficit and a shrinking Fed balance sheet. Investors will have to absorb more than twice the supply of Treasuries this year as over the past three years. Longer-term interest rates have already started to rise and may rise further, since stocks and real estate valuations are based in part on the present discounted value of the stream of income generated by the assets. The assumption that the longer-term yields used for discounting future income are permanently and reliably lower may be tested as 2018 unfolds.
Optimism Bubbling Up Everywhere
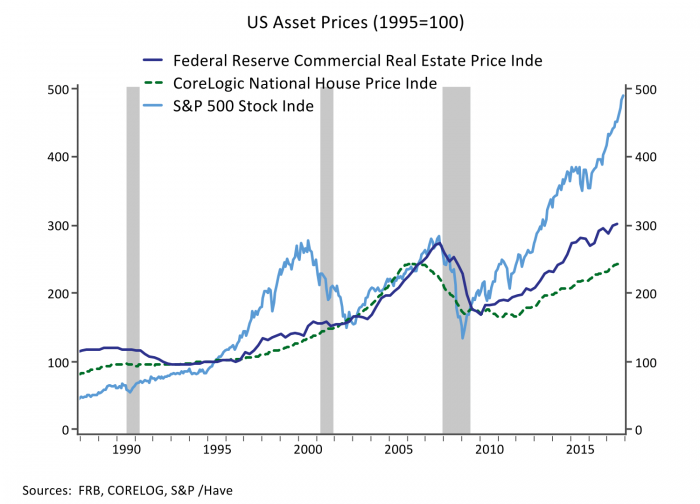
Every day seemingly brings news of new highs in the stock market. However, Figure 1 illustrates that valuations across many asset classes are reaching new highs. The chart shows the S&P 500 stock index alongside the Federal Reserve’s index of commercial real estate values and a national house price index from CoreLogic, all indexed to 1995.[i] While equities are vastly outperforming real estate in non-risk-adjusted terms, after a lull in 2014-2015 when the global economy weathered a China-led slowdown that collapsed commodity prices and hit the US energy and exporting sectors, valuations are again climbing across nearly all asset classes.
Do a Little Dance
Figure 1 highlights that asset prices – and stock prices in particular – can be highly cyclical and subject to waves of optimism or pessimism. In a previous post we highlighted that this is not a new phenomenon, as it was Keynes who coined the phrase “the market can stay irrational longer than you can stay solvent.” Keynes noted that increased uncertainty, such as arguably characterizes our globalizing and tech-driven economy, may make the market even less reliable, noting that “the market will be subject to waves of optimistic and pessimistic sentiment, which are unreasoning and yet in a sense legitimate where no solid basis exists for a reasonable calculation”.
Keynes also highlighted that the more liquid the market, the more subject it would likely be to waves of speculation divorced from fundamental valuations, which can help explain why the stock market exhibits more dramatic cyclical swings than real estate, although the degree of financialization that has come to real estate in recent decades has increased the cyclicality of valuations. Keynes’ characterization of market valuations was paraphrased in mid-2007 by then Citigroup CEO Chuck Prince who when asked about valuations in the subprime mortgage market noted that “when the music stops, in terms of liquidity, things will be complicated. But as long as the music is playing, you’ve got to get up and dance. We’re still dancing.” We know now that the music stopped not long after Prince made his famous remark.
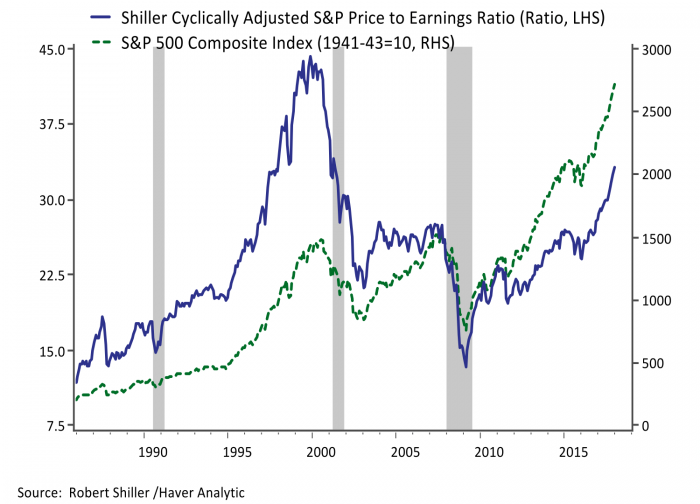
Another famous characterization of the emotions that can drive market valuations came from Nobel Prize winning economist Robert Shiller, who titled his book “Irrational Exuberance” published in 2000 just prior to the dotcom crash using a phrase coined by Alan Greenspan in 1996 to describe the stock market momentum. Shiller developed the Cyclically Adjusted Price Earnings Ratio (CAPE) to gauge equity valuations. Instead of looking at current earnings, the CAPE takes a ten-year average of earnings adjusted for inflation. Shiller’s measure is plotted alongside the S&P 500 Index in Figure 2; it indicates that the late 1990s boom was the period of most overt overvaluation, while current valuations are now in second place and moving up rapidly. Shiller is a strong proponent of behavioral economics and has noted in recent interviews that the stock market appears to be increasingly driven by psychological factors.
Banking on a Conundrum
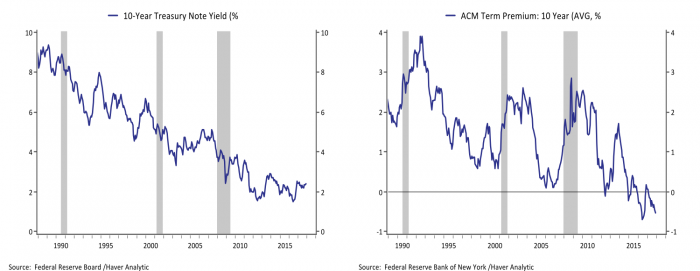
A frequent critique of Shiller’s CAPE ratio is that is doesn’t take into account the influence of low and stable long-term interest rates. Stocks and real estate valuations are based in part on the present discounted value of the stream of income generated by the assets. If the interest rate used to discount these cash flows is permanently and reliably lower then asset valuations should indeed be higher, although in general this argument can explain a higher level of valuation rather than a permanent upward trend in asset values. Figure 3 highlights that the average yield on the 10-year Treasury bond is less than half what it was in the late 1990s. In 2005 at his semi-annual testimony before Congress, then Federal Reserve Chairman Alan Greenspan called the persistent anchoring of low long-term yields a “conundrum” and the bond conundrum has stood the test of time, and only deepened further.
The drift lower in longer-term Treasury yields is shown in the left panel of Figure 3; the 10-year Treasury yield averaged close to 6% in the late 1990s, nearly 4.5% in the five years preceding the Great Recession, and just 2.25% over the past five years. Part of the decline in yields comes from lower estimates of potential economic growth stemming from slower population growth, and more recently slower productivity growth and a portion from low and stable inflation.
However slower growth and low inflation should also translate into a moderation in the nominal earnings growth embedded in stock and real estate valuations, and therefore low rates may not justify higher valuations. The third component of bond yields is the term premium, one measure of which is plotted in the right panel of Figure 3. The term premium is the risk premium demanded by investors for holding a longer-term bond over shorter-term securities, and when Greenspan dubbed persistently low yields a conundrum the term premium on the 10-year Treasury was close to zero. The term premium has been persistently in negative territory for the past four years suggesting investors are paying for the privilege of holding long-term securities over shorter dated notes. A key question for investors in all asset classes is whether that can be expected to persist.
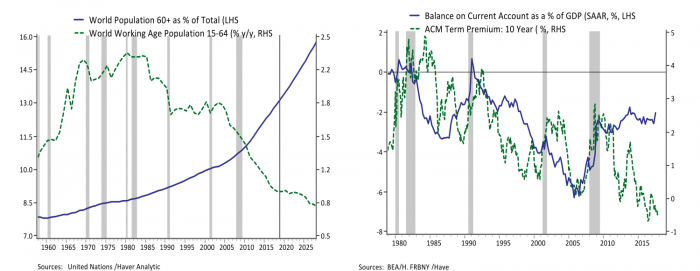
In order to assess the likely staying power of the bond conundrum it is worth exploring its demand and supply side drivers. Strong demand for safe assets was thought to be the early culprit driving the bond conundrum. Shortly after Greenspan identified the bond conundrum, then Governor Ben Bernanke outlined some of its drivers in a speech in which he first outlined the global savings glut. One source of increased demand for safe assets is an aging global population, and the left panel of Figure 4 highlights that that source of demand is only likely to intensify in coming years. A second source of demand comes the position of the dollar as the global reserve currency and exchange rate management in China and elsewhere. The right panel of Figure 4 shows that one manifestation of this dimension of globalization was a widening in the US trade deficit, and the ebbs and flows in the US current account deficit have been reasonably well aligned with the evolution of the term premia until the current cycle. In recent years the trade deficit has been more or less stable as a % of GDP even as the term premia has continued to drop precipitously.
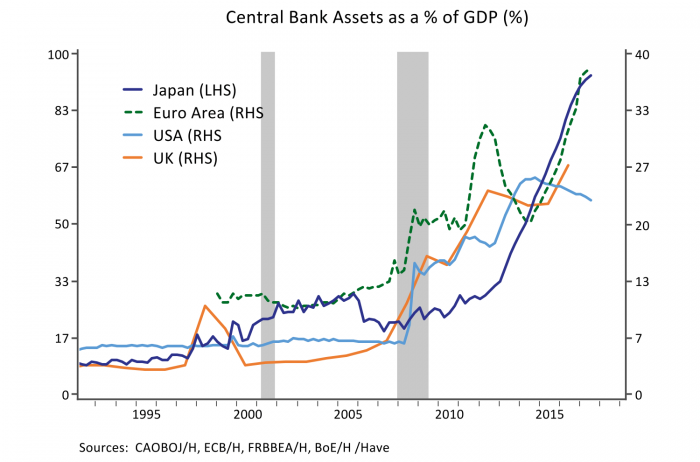
Supply side considerations help explain the continued decline in term premium embedded in longer-term bond yields in recent years. In the aftermath of the Great Recession, having cut short-term interest rates to zero, the Federal Reserve and other central banks around the world started buying bonds in an effort to stimulate the economy through lower yields and risk premia. Figure 5 shows central bank balance sheets as % of GDP. Note that Japan is on a different scale from the other countries in the chart; the Bank of Japan’s balance sheet stood at 93% of GDP as of Q3 2017. The Fed’s balance sheet has been shrinking as a % of GDP in the past three years simply by holding its balance sheet steady as GDP continues to grow. Buying and holding bonds means less supply for other investors thereby driving up the price and driving down yields. In addition to monetary policy, regulations implemented since the global financial crisis require banks to hold more safe assets creating an inelastic demand for the reduced supply of safe assets.
Ch-ch-changes in the 2018 Outlook Point to Increased Supply of Bonds
Two elements of the bond conundrum on supply side are about to change materially in 2018. With the US economy growing at a solid pace and the unemployment rate back to historical lows, the Fed judged that the economy is no longer in need of the extraordinary support it provided after the Great recession, and it began to actively shrink its balance sheet in Q4 2017 by reducing the amount of maturing Treasuries on its balance sheet that it reinvests. It plans to accelerate the pace at which it shrinks its balance sheet as 2018 progresses. Taking into account the schedule of maturities the pace of effective net Treasury selling by the Fed will pick up from just over $11bn in Q4 2017 to $229bn in 2018 and $267bn in 2019.
Meanwhile the federal deficit is potentially set to expand by as much as $300bn in 2018 and a similar amount in 2019. The JCT estimated that the Tax Cuts and Jobs Act is likely to expand the deficit by $135.7bn in fiscal year 2018 and $208bn in fiscal year 2019. On the spending side the haggling over the 2018 spending bill continues, and may not be fully resolved by January 19, but Republicans have become willing to engage in deficit-financed defense spending again, and Democrats are demanding matching increases in nondefense spending in addition to providing another tranche of hurricane relief spending. The federal deficit has already been widening by an average of $100bn over the past two fiscal years as growth in tax receipts has slowed. Tax and spending policy changes suggest that pace of deterioration will more than double over the next two years.
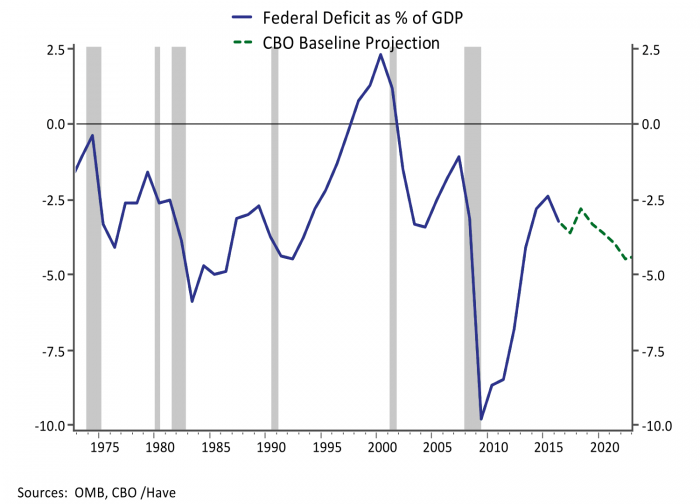
Sometime after the spending bill passes the Congressional Budget Office will publish updated deficit projections. Figure 6 shows the CBO’s current baseline projection of the federal deficit as a % of GDP. The upcoming revision will eliminate the previously expected 2018 improvement and likely shift the entire trajectory down by around 2 percentage points of GDP. Growing deficits in entitlement programs combined with significant fiscal stimulus at a time when the economy is humming along suggests that the US fiscal picture would move into overtly unsustainable territory if the government needed to provide additional deficit-financed fiscal stimulus in the event of another recession at some point. In the near term, the widening federal deficit combined with the Fed’s shrinking balance sheet means investors will have to absorb roughly double the amount of Treasuries as in the past three years. Bond yields are likely to remain low by historical standards, but policymakers are doing everything in their power to engineer some increase this year. Time will tell how much of a risk factor that is for risky asset markets that have been inclined to see all developments through rose-colored glasses of late.
The yield on the 10-year Treasury bond rose above 2.50% recently for the first time since last March. Much of last year featured a surprising decline in longer-term interest rates after March even as short-term yields rose on expectations of more Fed rate hikes. The minutes from the most recent meeting of Federal Reserve policy makers indicated that the accompanying flattening in the yield curve had raised concern given the track record of a flattening yield curve as a recessionary indicator. However longer-term interest rates may rise further on reduced fiscal and monetary support, particularly if the economy stays on track. Since stocks and real-estate valuations are based in part on the present discounted value of the stream of income generated by the assets, rising yields could be a headwind to current valuations even with a decent economic performance. The hard part of forecasting such an outcome is the powerful psychology that has become a self-reinforcing source of support for asset values. We wrote in a prior post how market psychology is further bolstered by a trend toward passive investment. At a minimum it seems the risks around bond yields seem more clearly skewed toward correction than in recent years.
[i] The commercial real estate published by the Federal Reserve Board is used in the stress tests conducted under the Dodd-Frank Act. From 2004:Q4 to 2011:Q4, the FRB used the National Council of Real Estate Investment Fudiciaries index NCREIF, using transaction-based series rather than appraisal-based. In 2012:Q1, the FRB switched to Costar Commercial Repeat Sales Index. A single, repeat-sales regression equation is used to estimate an index for all commercial properties.
