
Low-income housing programs that work: Part II
In our last blog post, we argued that a successful low-income housing policy is centered on two pillars. The first pillar is reform of land use and development regulations that strike the right balance between NIMBY and YIMBY – a topic we will discuss in future posts. The second pillar is refocusing whatever assistance we propose to give low-income and other targeted households: specifically, to subsidize households primarily through demand-side subsidies. HUD’s Housing Choice Vouchers are the main such subsidy in the United States.
In the first post we studied the basics of vouchers: how they’ve evolved in the U.S., how they compare to other programs, and why they are generally a better way to use valuable taxpayer dollars than subsidizing construction. In addressing why vouchers are generally better than other programs, we previously focused on the analysis of the costs and benefits of receiving different kinds of housing subsidies from the perspective of individual households and suppliers. In economic jargon, we studied how program design affects a consumer’s surplus and the transfer efficiency of the program on the demand side. On the supply side, we examined production efficiency, that is, the market value of units produced or utilized compared to their cost of production. Empirical research demonstrates that both production efficiency and transfer efficiency is higher in tenant-focused demand-side programs like vouchers, compared to project-based supply-side programs like public housing.
We left the last post with a cliffhanger. Last week’s analysis assumes producers and consumers of subsidized housing were “price takers;” that is, we assumed that they are “small” relative to the entire market, and hence don’t affect housing prices or rents overall. But what if that is not the case? What if the costs and/or benefits of housing subsidies, of whatever kind, spilled over into the broader housing market? Our first task today, then, is to examine possible market effects of housing subsidies, to complement our previous analysis of the effects to individual households and individual housing producers.
After we discuss potential market effects in Section 1, we will examine some other features of vouchers. Previously, when we examined who receives vouchers (or other subsidies), we focused on income. We did note that there are other considerations for recipients of subsidies, including age and household composition, and disability. We will discuss these and other related household characteristics briefly in Section 2.
Low-income housing assistance is an important part of the household safety net. HUD spends approximately $50 billion every year. Section 3 puts this expenditure into perspective with a brief comparison of housing assistance with other income transfer programs. Some of these programs are targeted to low-income households, “means-tested” in the jargon. Examples of means-tested programs include Medicaid, food stamps, the Earned Income Tax Credit, and so on. Other programs, “not means-tested,” are available largely regardless of income (although in practice these programs usually include significant numbers of low-income households among their recipients). Examples include Social Security, Medicare, and unemployment insurance. Currently the entire portfolio of Federal income transfers of both kinds comprises about $2.8 trillion. $50 billion of that amount are low-income housing expenditures which, while by no means trivial, are less than 2 percent of the total.
Section 4 returns to housing subsidies, but branches out to consider both low-income subsidies – such as vouchers, public housing, and the Low-Income Housing Tax Credit – and also to include other housing subsidies not tied to low incomes. These latter subsidies come mainly through the tax system. Recent changes through the Tax Cuts and Jobs Act 2017 have focused attention on the mortgage interest deduction and the deduction for state and local property taxes. We examine the current distribution of all these subsidies, setting the stage for our future blog post providing some analysis of the TCJA changes in the tax code slated to take effect in 2018.
Most of our housing subsidy analysis so far has focused on national data. Today’s post finishes with a look at utilization of subsidies in the 50 states and the District of Columbia, examining inter alia how New Jersey and our neighboring states compared to the rest of the country in the utilization of vouchers and Federal supply-side programs.
That’s a lot to cover. More is on the way! Our third blog entry, in several weeks, will examine additional details about vouchers, focusing on current proposals for change by the Administration and by Congress; it will also offer some suggestions for improvement.
In February we will tackle the other key set of policies in our two-pronged approach: improving the regulatory environment and striking the right balance between NIMBYism and YIMBYism.
1. Evaluation of Vouchers, and Other Housing Programs, from the Market/Macro Perspective
To reiterate our previous post, our cost-benefit analyses were for single representative consumers and/or producers. What about the possible spillovers from the subsidized households/units, to the larger housing market?
Evidence on the market effects of housing programs is of two kinds: direct and indirect. Direct evidence stems primarily from the Experimental Housing Allowance Program’s Supply Experiment. Indirect evidence stems from several research papers on the price elasticity of supply, or the overall responsiveness of the housing market.
First, a little foreshadowing. We’ll find that key results depend on how elastic the supply of housing is in a given market. Most readers will remember elasticities of supply and demand from their Econ 101 course. Intuitively, it’s simple: a more elastic market is more responsive. That is, if price rises (or falls), the supply of housing increases (or shrinks) accordingly. Put another way, in an elastic or responsive market, changes in demand call forth “large” changes in the quantity of housing provided in the market; price changes are “small.” In an inelastic market, the supply is fixed, or at least slow to respond. Changes in demand result in “large” changes in price, and “small changes in quantity of housing. Put yet another way, very loosely: in elastic markets supply curves are flat and in inelastic markets they are steep. Readers desiring a little more review and analysis can click here.
Here we will demonstrate that, if supply is very inelastic, supply-side strategies could conceivably add to the housing stock and could bring down the price of housing generally. If supply is very inelastic, demand side subsidies could raise prices and might not result in much additional housing.
On the other hand, if supply is very elastic, supply strategies do not add to the stock, but simply crowd out private investment; there are no market price effects. With elastic supply, demand-side subsidies have no price effects, but can increase the stock of housing as supply rises to meet demand.
We will also briefly develop the notion that supply elasticity is partly due to “states of nature,” i.e. time frames, and sometimes to natural constraint. But much of the variation in supply conditions is also under government control, or at least strongly influenced by government interventions – not just housing subsidies but also taxes, and especially regulations. But first, let’s illustrate the propositions we put forward above using market supply and demand analysis.
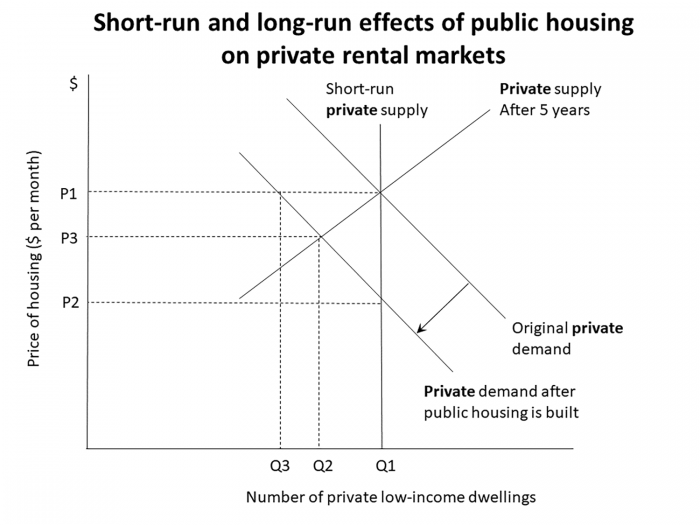
Exhibit 1
To study the market effects of demand side programs, we begin by studying the market effects of supply-side programs like public housing. See Exhibit 1.
Exhibit 7 of the pevious post presented a demand curve for a single individual. Exhibit 1 of this post looks similar, but has a crucial difference: it presents the demand (and supply) for the market. Specifically, this is the market for our city’s private rental housing. Public housing construction, if undertaken, occurs “off-stage,” but does affect demand for private rental, since we assume for now a “closed city” with a fixed number of households; each lives in only one house. Building public housing thus reduces demand for private housing.
For simplicity, we assume all houses are the same, and the vacancy rate is constant. We assume the private rental housing is competitive so that landlords initially cover their costs, including normal profits.
Suppose we started in equilibrium at P1, Q1, with no public housing; then the government builds some public units “off-stage.” The construction of new public housing decreases the demand for private low-income housing, i.e. the private demand curve shifts down. In the short run, the supply of private housing is fixed, so the price of private dwellings drops from P1 to P2. Landlords are no longer covering their costs. Thus, households who have moved from the private market to the (presumably less expensive) public units are better off; the remaining tenants are paying lower rents, so they are better off too. Economists refer to this as a “pecuniary externality.” Of course, the pecuniary externality cuts both ways: tenants benefit, but landlords in the private market suffer.
Over an intermediate (5-year?) period, where we have greater supply elasticity, landlords will abandon or repurpose some units. As drawn, adjustment to the new lower rent decreases the quantity of housing supplied from Q1 to Q2, and the price rises to P3. Landlords are still below cost, but losing less than at Q1.
The longer the period of time, the greater the displacement of private housing, and the smaller the net decrease in price. In the long run, if supply is perfectly elastic, landlords will exit the market until prices return to their normal level, covering costs including normal profit, i.e. at Q3 and P1.
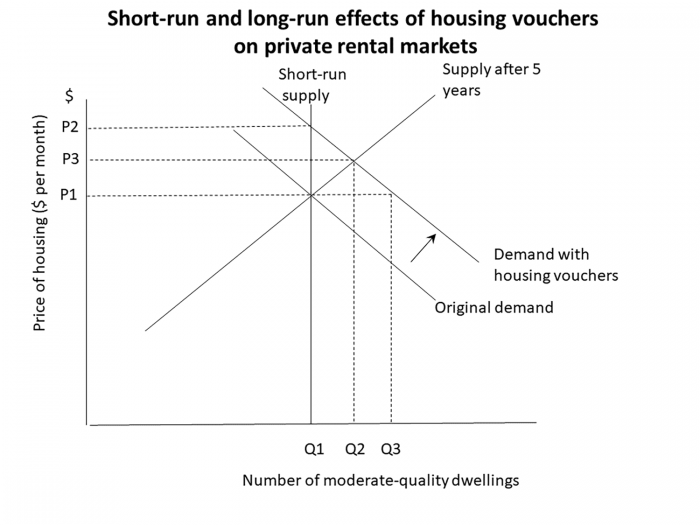
Exhibit 2
Now let us consider the short-run and long-run effects of housing vouchers on private rental markets using Exhibit 2. The basic setup is the same, but instead of building public units that compete with the private sector, the government provides vouchers to tenants. The housing-voucher program increases the demand for private rental.
In the short run, the supply of private rental housing is fixed, so the price increases from P1 to P2. The underlying cost structure has not changed, so landlords are now making excess profits. The voucher program yields negative pecuniary benefits to tenants, positive ones to landlords.
Over the intermediate five-year period, the increase in rents provides an incentive for new rental construction; the quantity supplied increases from Q1 to Q2, and the price drops to P3.
The longer the period of time, the greater the increase in the quantity supplied and the smaller the net increase in price. If supply is elastic, we return to P1 at a new, higher Q3.
Now let us pull these results from Exhibits 8 and 9 together. The above analysis demonstrates the market effects of housing policies. To repeat –
If supply is very inelastic:
- Supply strategies add to the stock, and will bring down the price of housing generally.
- Demand-side subsidies raise prices and do not result in much housing.
If supply is very elastic:
- Supply strategies do not add to the stock, but simply crowd out private investment; there are no price effects.
- Demand side subsidies have no price effects, but can increase the stock of housing as supply rises to meet demand.
So the price elasticity of supply of housing is a key market parameter.
We have already noted that evidence on the market effects of housing programs is of two kinds: direct and indirect. Direct evidence stems primarily from the Experimental Housing Allowance Program’s Supply Experiment. It was the sort of analysis just undertaken that was the motivation for the Supply Experiment. As John Weicher expressed the motivation, “Probably the most common concern expressed by critics of tenant-based assistance has been that these programs simply let landlords raise rents without improving housing quality.” The Supply Experiment was carried out to test this. It was carried out as part of EHAP in two cities, Green Bay and South Bend. In the event, despite running a “large” housing allowance (voucher) program, little if any price effects were observed.
These EHAP results, and some others, underlie the view, widely held among housing economists, that market effects don’t obviate the other advantages of vouchers over supply side approaches (but see the 1990 debate among Apgar, Struyk and Weicher for contrary views). Our Micro 101 analysis above showed that the lack of such spillovers is most likely even with a “large” program if the supply of housing is elastic, at least in the long run. What does research on the responsiveness of supply tell us?
A number of studies such as Muth (1960), Follain (1979) and Malpezzi and Maclennan (2001) support a fairly elastic U.S. market, estimating a “national average” price elasticity of supply of say 10 or more; their supply curves are very “flat.” But several other studies such as Poterba (1991) and Topol and Rosen (1988) find smaller elasticities (on the order of 2); their supply curves are “steeper.”
Another strand of market-level evidence comprises studies of “crowding out,” or lack thereof, of market units by supply side programs, such as Murray (1983, 1999), Malpezzi and Vandell (2002), and Sinai and Waldfogel (2005), which generally support high degrees of crowding out by supply side programs, implying substantial supply elasticities and greater efficacy of vouchers.
A third strand of literature, including Saiz (2008) Green Malpezzi and Mayo (2005), and Eriksen and Ross (2014) emphasize that supply elasticities vary by metropolitan area, a key point that will underlie our argument that demand-side programs – in fact any housing program, including second or fifth best solutions like the LIHTC or public housing – work best with a responsive market, and that at least some of this responsiveness is strongly linked to land use and development regulation, as we will develop in our third post in this series.
2. Who Gets Housing Vouchers? It’s Not Just About Income
Our first post on vouchers included a detailed discussion of the role of income in targeting housing subsidies. This included a discussion of HUD’s local income limits based on Area Median Income (AMI): Low Income (LI, below 80 percent of AMI); Very Low Income (VLI, below 50 percent of AMI); and Extremely Low Income (ELI, below 30 percent of AMI).
We noted in the first post that there are other criteria that come into play, including household composition – whether elderly or children are present, and also whether household members are disabled. By some measures, disabilities are surprisingly widely distributed among the population especially but not only the older population as shown in Exhibit 3.
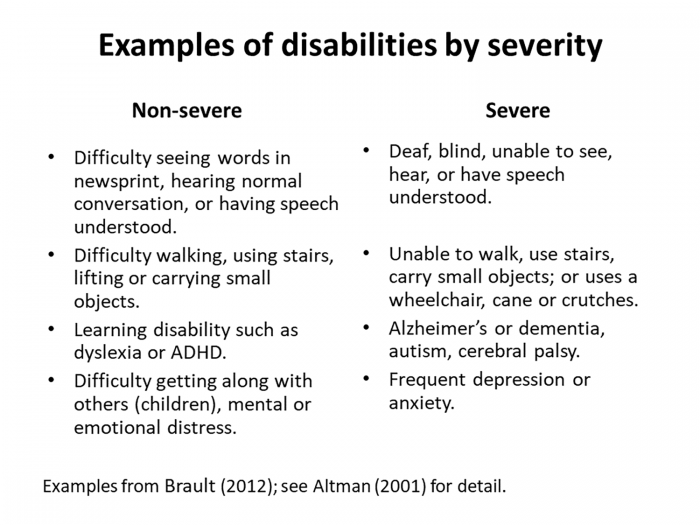
Exhibit 3
How is disability defined? Exhibit 4 provides a few representative examples from Brault (2012), but the book by Altman (2001) provides much greater detail.
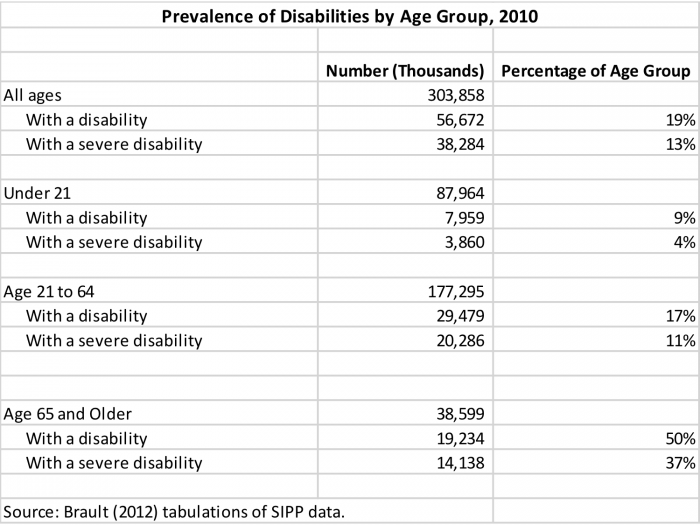
Exhibit 4
Generally, there is an interaction between disabilities and income. There is a significant population of disabled, especially the older population, who have one or more disabilities, but have sufficient income to address any housing issues arising from their disability without participating in a subsidized housing program. Virtually all readers will know older individuals using canes or walkers, for example, who remain in their original unit, unsubsidized. But such a disability, along with lower income, can move you further up the queue to receive subsidies. Mansell and Beadle-Brown (2009) discusses alternative approaches to housing the disabled in greater detail.
It turns out that a significant percentage of households receiving housing vouchers report one or more disabilities. With respect to household composition, many Housing Choice Voucher recipients are in households with older heads and/or with children present. Exhibit 5 presents some data.
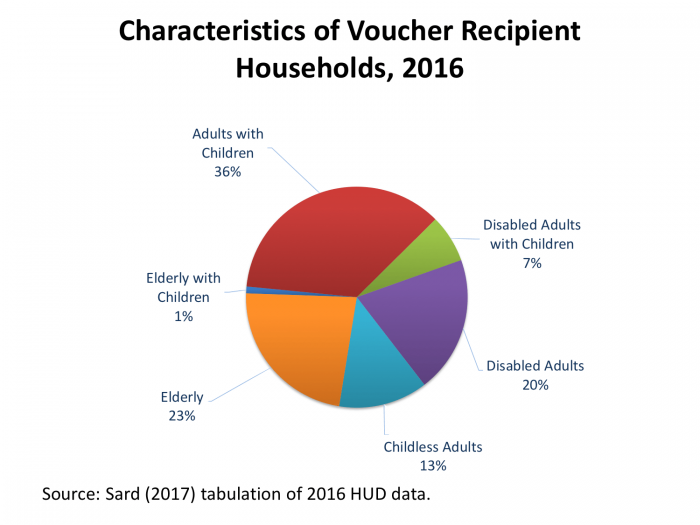
Exhibit 5
Exhibit 5, from Barbara Sard of the Center for Budget and Policy Priorities, analyzes HUD administrative data to estimate the fraction of voucher recipient households with different characteristics. Over one quarter of voucher recipients (27 percent) are reportedly disabled. Well over one third (37 percent) are households with children. Almost one quarter are elderly (see Struyk 1985).
Only about one in eight households receiving HUD’s subsidy vouchers is a non-elderly, nondisabled, childless adult. This will have important implications in the next blog post, when we discuss some proposals for housing choice voucher reforms.
This brief discussion of disabilities, and of household composition by age complements our prior discussion of income, but does not exhaust the topic of targeting or special needs populations. There is literature we can delve into in the future on vouchers provided for the formerly homeless (Rosenbach et al. 2003), for housing veterans (Kasprow et al. 2000), and for those who faced natural or other disasters (Popkin, Turner and Burt 2006).
3. Housing Subsidies in the Broader Safety Net
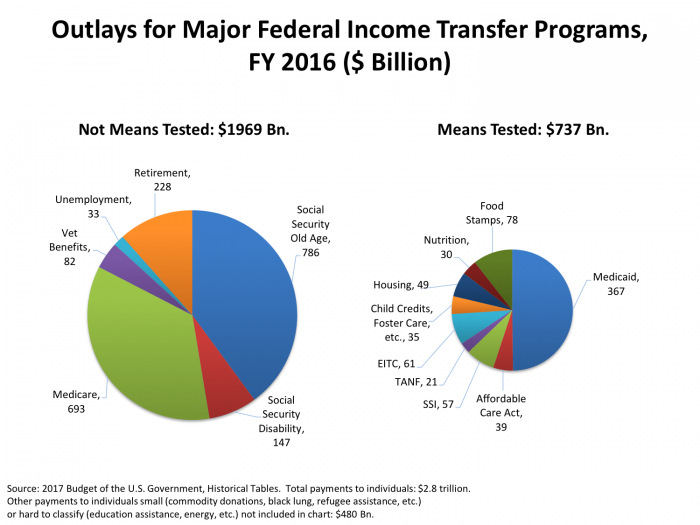
Exhibit 6
Exhibit 6 presents two pie charts that are proportional in size to the dollars spent on two broad categories representing $2.3 trillion of the $2.8 trillion in federal income transfer programs. These are split into means-tested programs, which are targeted largely by income; and non-means tested programs. Currie (2008) is a good introduction to the various elements of the broader safety net.
Examples of means-tested programs include low-income housing subsidies, food stamps (SNAP), Temporary Assistance for Needy Families (TANF), and the Earned Income Tax Credit (EITC). Non-means-tested programs are available to households based on other considerations such as age or employment or veteran status, but at least on their face not based on income, such as Social Security, Medicare, and unemployment insurance.
There is another $480 billion in Federal payments to households which are not allocated to one of the two pies in Exhibit 6. Some are omitted because their outlays are relatively small, such as payments to miners for black lung, or commodity donations, or refugee assistance. Others are hard to classify as either means-tested or not-means-tested, since the groupings include some of each. Education assistance and energy programs are examples of programs omitted on these grounds.
The first thing to notice is the fact that the Big 3 – Social Security, Medicare, and Medicaid – together represent about $2 trillion of federal spending annually. Medicaid is more than half of means-tested program spending. Medicare and Social Security dominate the non-means-tested categories.
Housing programs, supply-side and demand-side, are an important part of this social safety net – but only part. Adding up all HUD’s housing programs, and rounding a bit, we spent about $50 billion in Federal taxpayer money each year on housing low-income households. Exhibit 6 shows how these expenditures fit into the bigger safety net picture. HUD’s low-income housing expenditures are less than 2 percent of the $2.8 trillion that 120 million taxpaying U.S. households pay (largely the same, albeit different amounts) 120 million subsidy-receiving households.
(The oft-repeated comment that half of U.S. households pay Federal income tax is correct but incomplete. Virtually every U.S. household pays Federal taxes of some kind, including the income tax but also Federal Insurance Contribution Act taxes (FICA), excise taxes and so on. FICA is now almost equal to the take from the income tax. When we study the scope of Federal programs, it’s hard to find many households, rich or poor, who don’t receive some Federal subsidy, direct or indirect.)
4. Equity and Distributional Issues in Housing Subsidies
There are two main types of distributional or equity issues. The first, horizontal equity, is best phrased as “equal treatment of equals.” Most commonly in policy analysis we define equals as more or less those with equal or similar incomes, although there are important exceptions, e.g. when age or physical limitations are considered. This principle is violated if, for example, we have two families of a given income, one of whom receives a deep housing subsidy while the other, equally deserving, receives no assistance.
The second equity principle, vertical equity, is a little tricky. Vertical equity is about the treatment of unequals. It is about how society treats rich vs. poor, or for that matter poor vs. middle income, or moderately poor from the poorest. Much of politics is making choices about vertical (as well as horizontal) equity. While vertical equity often requires some political judgment, many readers might agree with some very general propositions. For example, many might agree that larger housing subsidies should go to lower income households, rather than higher. So while we cannot make precise statements about the desired outcomes in the housing market in terms of vertical equity, we can certainly make general statements of the form “larger subsidies are going to richer households, and this violates generally held norms of vertical equity in society.”
In the event, how do these housing subsidies break out?
As we have already noted, households are theoretically eligible for vouchers and other HUD housing subsidies if their adjusted incomes are below 50 percent of area median income (Very Low-Income households), although HUD required PHAs to target at least 75 percent of their vouchers to Extremely Low-Income households (ELI threshold below 30 percent of area median income). Of course, income is not the only variable PHAs (and HUD) takes into consideration, but it is usually the starting point.
Generally, about a third of eligible low-income households receive vouchers, live in public housing, or receive some other significant housing assistance. Olsen (2008) provides detailed breakdowns; after adjusting for real cost differences across metropolitan areas, only 32 percent of households in the bottom decile of the income distribution receive such assistance.
Thus the current voucher system provides subsidies to a small fraction of those technically eligible. Given this violation of horizontal equity, many analysts, including Quigley (2011) and Olsen (2008), argue for redesigning vouchers to reach more households even though this would require shallower subsidies. Olsen provides a detailed discussion and roadmap for alternatives.
What about vertical equity? Here it’s necessary to broaden our view of housing subsidies. HUD provides subsidies through vouchers, public housing, etc. These go to low income households. But it’s well known that the U.S. tax code provides subsidies through the deductions for mortgage interest and property taxes. Most of these go to upper income households.
Richer households have larger mortgages, and higher property tax bills. Their deductions are also more valuable because generally they are in a higher marginal tax bracket.
Carasso, Steuerle and Bell (2005) have estimated the size and incidence of these subsidies by income group. Exhibit 7 presents the average housing subsidy, by income. Exhibit 8 presents the approximate fraction of U.S. households in each income group.
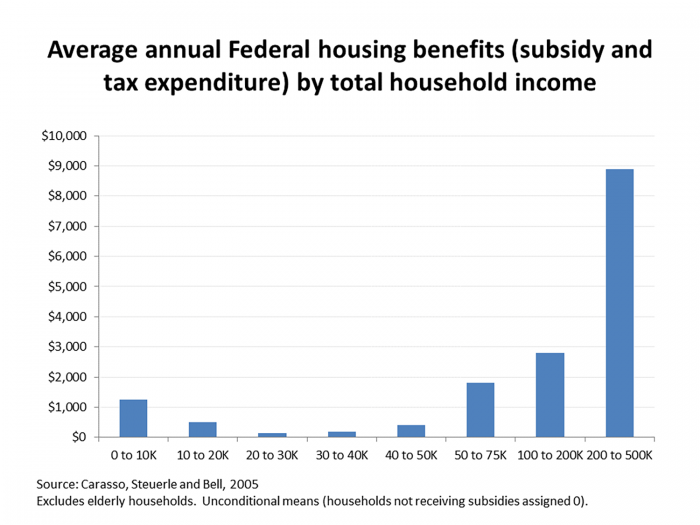
Exhibit 7
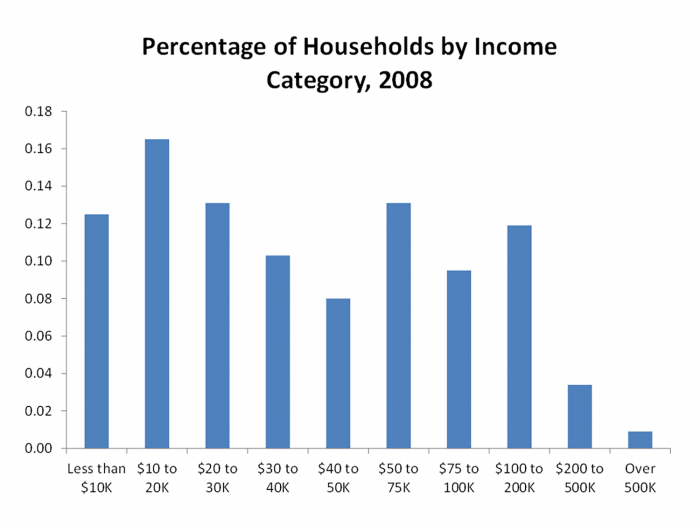
Exhibit 8
If one accepts the proposition that vertical equity requires larger subsidies for poor households and smaller subsidies for rich households, the distribution of subsidies in the U.S. is problematic. We provide modest housing subsidies to poor people, on the order of $1,000 per household.
Of course, some poor get much larger subsidies; most poor get little or nothing. Less than a third of eligible low-income households receive subsidies. Housing vouchers etc. are not an “entitlement” like Medicare or tax expenditures.
We provide much larger subsidies to upper income households through tax expenditures. These are entitlements, i.e., if you qualify you receive them you get them. To qualify, you are required to have a mortgage and you must live somewhere that charges property taxes.
We provide very little housing subsidy, on average, to the middle class. Well, that gives us something very interesting to discuss in a future blog post, along with some counter-arguments in favor of the interest deduction, as laid out in Woodward and Weicher (1989).
5. Vouchers and Other Low-Income Subsidies in New Jersey and Other States
In this and our previous post, we focused on Housing Choice Vouchers and other housing subsidies at the national level. When we went local, it was to examine results from one study or another that relied on data from one or a few markets.
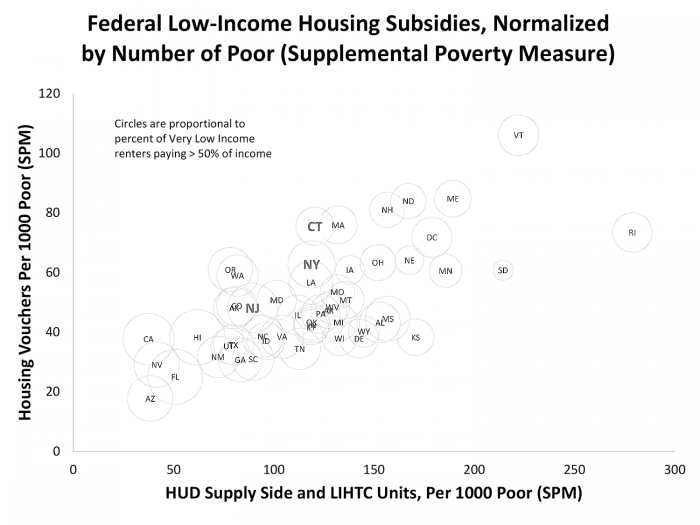
Exhibit 9
Exhibit 9 presents data on Housing Choice Voucher utilization by the 50 states and the District of Columbia, as well as the utilization of Federal supply side programs. The vertical axis is each state’s 2015 count of housing vouchers, divided by the number of poor persons. As in our blog on housing affordability, we do not use the “headline” U.S. poverty measure, since that measure does not account for differences in housing costs and other cost-of-living variation across states. Instead we use the supplemental measure calculated by Bureau of Labor Statistics and Census staff which is adjusted for cost-of-living differences.
There is a lot of variation in state utilization of vouchers, ranging from a low of 18 per 1000 poor persons (Arizona) to 106 per 1000 poor in Vermont. New Jersey, at 48 vouchers per 1000 population, is slightly above the national average of 44 per 1000. New York at 63 per thousand, and Connecticut at 76 per thousand are well above average as well.
There is even greater variation in the utilization of supply side subsidies (public housing, other HUD project-based subsidies, and the Low-Income Housing Tax Credit Program). These range from 38 per 1000 poor population (again, Arizona) to 279 per 1000 poor population in Rhode Island. Vermont, number one in voucher utilization, comes in at number two with 222 supply-side units per 1000 poor population. Our local states come in at 89 per 1000 (New Jersey), 119 per 1000 (New York) and 120 per 1000 (Connecticut). This compares to a national average of 95 per 1000 poor persons.
There are some other patterns to investigate in Exhibit 9. Perhaps variation in subsidy availability is connected to rents at the bottom of the market? Not clearly so. The area of the circle around each state is proportional to the percentage of very low-income households paying 50 percent or more of their income on rent, a measure we used in our previous discussion of housing affordability. While some high utilization states such as Vermont and Rhode Island are around the national average for this affordability measure, one of those high utilization states, South Dakota, is actually the lowest. Some of the markets with the least voucher or supply-side activity have the biggest affordability problems, at least by the measurer used here. California, Florida and Hawaii are among those. But really, it’s hard to see any strong consistent link between this affordability measure and subsidy activity. More research on these links would be worthwhile.
Finally, there is a fairly strong positive correlation, as such state-wise plots go, between Housing Choice Voucher activity, and supply-side activity. It might not have been too surprising to see low or even negative correlation between these two, if vouchers and supply-side projects were “gross substitutes,” in economist’s jargon, states that do more (less) on the demand side do less (more) on the supply side. Instead, we see they are gross complements: states that are active in supply-side programs are also active on the demand side. It’s curious that some of the least subsidized states are the “sand states” (Florida, California, Nevada, Arizona) hardest hit by the 2006-2009 housing bust, though a causal mechanism is not obvious.
So this first plot of such state by state utilization shows enormous variation. A positive correlation between supply-side and demand-side programs suggests states that are active on one housing front are active in others. But there is much more to learn about these patterns; state by state subsidy utilization is a fruitful area for future research.
References
Altman, Barbara M. “Disability Definitions, Models, Classification Schemes, and Applications.” Handbook of disability studies (2001): 97-122.
Apgar, William C. Jr. “Which Housing Policy Is Best?”. Housing Policy Debate 1, no. 1 (1990): 1-32.
Brault, Matthew W. Americans with Disabilities: 2010. US Department of Commerce, Economics and Statistics Administration, US Census Bureau Washington, DC, 2012.
Carasso, Adam, C. Eugene Steuerle, and Elizabeth Bell. “Making Tax Incentives for Homeownership More Equitable and Efficient.” Washington, DC: Urban Institute, 2005.
Currie, Janet M. The Invisible Safety Net: Protecting the Nation’s Poor Children and Families. Princeton University Press, 2008.
Eriksen, Michael D, and Amanda Ross. “Housing Vouchers and the Price of Rental Housing.” American Economic Journal: Economic Policy 7, no. 3 (2015): 154-76.
Fischer, Will. “Research Shows Housing Vouchers Reduce Hardship and Provide Platform for Long-Term Gains among Children.” Center on Budget and Policy Priorities (2014).
Follain Jr, James R. “The Price Elasticity of the Long-Run Supply of New Housing Construction.” Land Economics 55, no. 2 (1979): 190-99.
Green, Richard K., and Stephen Malpezzi. A Primer on U.S. Housing Markets and Housing Policy. American Real Estate and Urban Economics Association Monograph Series. Washington, D.C.: Urban Institute Press, 2003.
Green, Richard K., Stephen Malpezzi, and Stephen K. Mayo. “Metropolitan-Specific Estimates of the Price Elasticity of Supply of Housing, and Their Sources.” [In English] Review of 2005. American Economic Review 95, no. 2 (May 2005): 334-39.
Kasprow, Wesley J, Robert A Rosenheck, Linda Frisman, and Diane DiLella. “Referral and Housing Processes in a Long-Term Supported Housing Program for Homeless Veterans.” Psychiatric Services 51, no. 8 (2000): 1017-23.
Leventhal, Tama, and Sandra Newman. “Housing and Child Development.” Children and Youth Services Review 32, no. 9 (2010): 1165-74.
Malpezzi, Stephen, and Duncan Maclennan. “The Long-Run Price Elasticity of Supply of New Residential Construction in the United States and the United Kingdom.” Journal of Housing Economics 10, no. 3 (September 2001): 278-306.
Malpezzi, Stephen, and Kerry Vandell. “Does the Low-Income Housing Tax Credit Increase the Supply of Housing?” Journal of Housing Economics 11, no. 4 (December 2002): 360-80.
Mansell, Jim, and Julie Beadle-Brown. “Dispersed or Clustered Housing for Adults with Intellectual Disability: A Systematic Review.” Journal of intellectual and developmental disability 34, no. 4 (2009): 313-23.
Murray, Michael P. “Subsidized and Unsubsidized Housing Stocks 1935 to 1987: Crowding out and Cointegration.” The Journal of Real Estate Finance and Economics 18, no. 1 (1999): 107-24.
Muth, Richard F. “The Demand for Non-Farm Housing.” In The Demand for Durable Goods, edited by A.C. Harberger, 29-96: University of Chicago Press, 1960.
Newman, Sandra. “The Living Conditions of Elderly Americans.” The Gerontologist 43, no. 1 (2003): 99.
Newman, Sandra, and C Scott Holupka. “The Effects of Assisted Housing on Child Well‐Being.” American journal of community psychology 60, no. 1-2 (2017): 66-78.
Popkin, Susan J, Margery Austin Turner, and Martha Burt. “Rebuilding Affordable Housing in New Orleans: The Challenge of Creating Inclusive Communities.” After Katrina: Rebuilding Equity and Opportunity into the New New Orleans (2006).
Poterba, James M. “House Price Dynamics: The Role of Tax Policy and Demography.” Brookings Papers on Economic Activity 1991, no. 2 (1991): 143-203.
Priemus, Hugo, Peter A Kemp, and David P Varady. “Housing Vouchers in the United States, Great Britain, and the Netherlands: Current Issues and Future Perspectives.” Housing Policy Debate 16, no. 3-4 (2005): 575-609.
Rosenheck, Robert, Wesley Kasprow, Linda Frisman, and Wen Liu-Mares. “Cost-Effectiveness of Supported Housing for Homeless Persons with Mental Illness.” Archives of General Psychiatry 60, no. 9 (2003): 940-51.
Saiz, Albert. “The Geographic Determinants of Housing Supply.” The Quarterly Journal of Economics 125, no. 3 (2010): 1253-96.
Sard, Barbara. “Housing Vouchers Should Be a Major Component of Future Housing Policy for the Lowest Income Families.” Cityscape 5, no. 2 (2001): 89-110.
Shaefer, H Luke, and Kathryn Edin. “Rising Extreme Poverty in the United States and the Response of Federal Means-Tested Transfer Programs.” Social Service Review 87, no. 2 (2013): 250-68.
Shaw, Kelly, C Cartwright, and Jocelyn Craig. “The Housing and Support Needs of People with an Intellectual Disability into Older Age.” Journal of Intellectual Disability Research 55, no. 9 (2011): 895-903.
Sinai, Todd, and Joel Waldfogel. “Do Low-Income Housing Subsidies Increase the Occupied Housing Stock?”. Journal of Public Economics 89, no. 11-12 (2005): 2137-64.
Smith, Stanley K, Stefan Rayer, and Eleanor A Smith. “Aging and Disability: Implications for the Housing Industry and Housing Policy in the United States.” Journal of the American Planning Association 74, no. 3 (2008): 289-306.
Struyk, Raymond J. “Comment on William Apgar’s,“Which Housing Policy Is Best?”.” Housing Policy Debate 1, no. 1 (1990): 41-51.
Struyk, Raymond J. “Future Housing Assistance Policy for the Elderly.” The Gerontologist 25, no. 1 (1985): 41-46.
Topel, Robert, and Sherwin Rosen. “Housing Investment in the United States.” The Journal of Political Economy 96, no. 4 (1988): 718-40.
Weicher, John C. “Comment on William Apgar’s “Which Housing Policy Is Best?”.” Housing Policy Debate 1, no. 1 (1990): 33-39.
———. Housing Policy at a Crossroads: The Why, How, and Who of Assistance Programs. AEI Press, 2012.
Woodward, Susan E, and John C Weicher. “Goring the Wrong Ox: A Defense of the Mortgage Interest Deduction.” National Tax Journal 42, no. 3 (1989): 301-13.